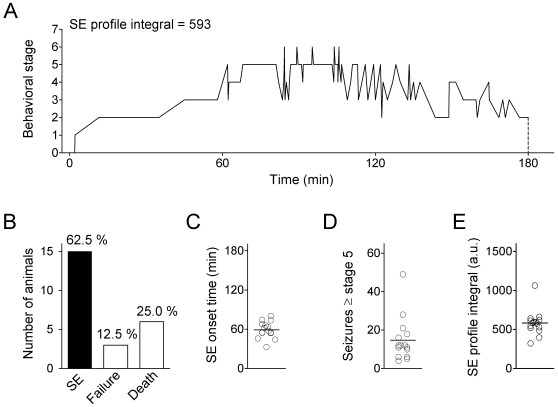
Figure 1. Monitoring status epilepticus induction in mice.
Status epilepticus (SE) was induced by an intraperitoneal (i.p.) injection of kainate in juvenile (3 weeks old) C57BL/6 mice. A. Typical SE profile (behavioral stage transitions over time); kainate was injected at time point 0, and the animal was sacrificed after 180 min). Behavioral analysis was based on an 8 point scale (0 to 7; see Methods). SE severity was quantified by the SE profile integral (area under SE profile curve between 0 and 180 min, number in arbitrary units; see Methods). B. Rate of successful SE induction (n = 15), failure (n = 3) and death (n = 6) within the group of all kainate-injected animals (n = 24). C. SE onset time (time until stage 5 was first reached, n = 15). D. Number of seizures ≥ stage 5 (n = 15). E. SE profile integral (a.u., arbitrary units; n = 15). Mean values are indicated by horizontal lines.

