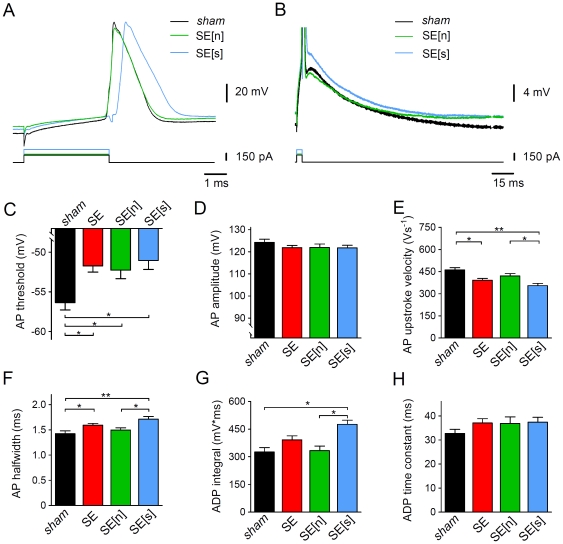
Figure 4. Properties of single somatic APs in CA1 pyramidal cells.
A and B. Single somatic APs elicited by a just suprathreshold current injection of 4 ms duration (as indicated) in a sham cell (black traces) and different SE cells. SE cells were subdivided in SE[n] (notch present, green traces) and SE[s] cells (smooth, notch absent, blue traces). APs are shown on different time and voltage scales in A and B, respectively; panel A shows that in the SE cells the AP threshold was less negative, AP upstroke velocity smaller and AP halfwidth larger than in the sham cell (artefacts in the voltage traces coincide with the on- and offset of the current pulse but not with the AP peak. They were accounted for in the analysis, see Methods); panel B shows the presence (SE[n]) or absence (SE[s]) of the notch typically preceding after-depolarization (ADP) in sham cells. Compared to the sham cell, the area under the corresponding part of the voltage trace (ADP integral) was larger in the SE[s] cell. C. AP threshold for sham (black), SE (red), SE[n] (green) and SE[s] cells (blue); n = 37, 61, 34 and 27, respectively; D. AP amplitude for sham, SE, SE[n] and SE[s] cells (n = 37, 61, 34 and 27); E. AP upstroke velocity for sham, SE, SE[n] and SE[s] cells (n = 37, 61, 34 and 27); F. AP halfwidth for sham, SE, SE[n] and SE[s] cells (n = 37, 61, 34 and 27); G. ADP integral for sham, SE, SE[n] and SE[s] cells (n = 28, 34, 20 and 14); H. ADP time constant (of decay) for sham, SE, SE[n] and SE[s] cells (n = 28, 34, 20 and 14); * p<0.05; ** p<0.001 (ANOVA).

