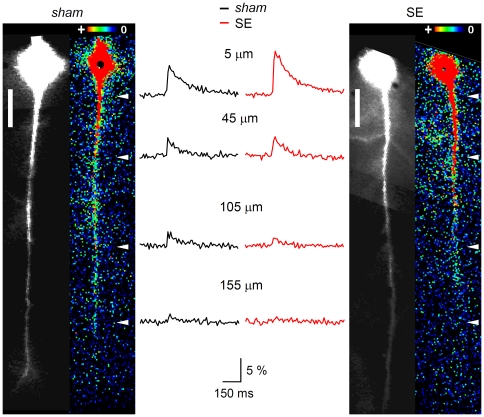
Figure 5. B-AP imaging in the apical dendrite of CA1 pyramidal cells.
The retrograde spread of excitation in the apical dendrite of CA1 pyramidal cells was studied with the Ca2+ imaging technique. A and C, left (black-and-white images). Sham and SE cell, respectively, filled with bis-Fura 2 via a somatic patch-pipette (not shown); scale bars: 25 µm. A and C, right (false color images). Same sham and SE cell, respectively, during backpropagation of an AP, which was generated by somatic current injection. The maximal Ca2+ signal (absolute fluorescence change, ΔF) caused by the b-AP along the apical dendrite is color-coded (see insets): red (+) represents large, dark blue low changes in fluorescence. B. Corresponding Ca2+ transients (ΔF/F in %) recorded from the sham (black) and the SE cell (red) shown in A and C, respectively, at 5, 45, 105 and 155 µm from the soma (see white arrowheads in A and C, right). Note that, despite the larger amplitude of the Ca2+ signal next to the soma, its decrease along the apical dendrite was stronger in the SE cell than in the sham cell.

