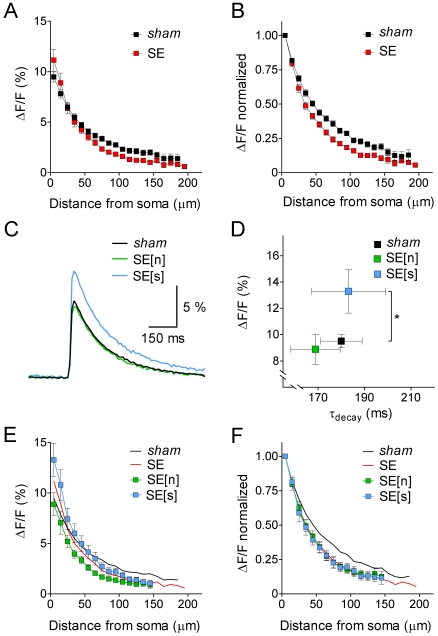
Figure 6. Quantitative analysis of the dynamics of b-AP-induced Ca2+ signals in CA1 pyramidal cells.
A. Maximal fluorescence changes (ΔF/F in %) along the apical dendrite (10 µm steps, starting 5 µm from the soma) for sham (black, n = 41 continuous data sets averaged) and SE cells (red, n = 39 continuous data sets averaged). Ca2+ signals in the proximal dendrite were slightly larger, but the overall attenuation of the b-AP-induced Ca2+ signal along the apical dendrite was stronger in SE versus sham cells (cross-over of data sets at 25 µm from the soma). B. B-AP imaging data normalized to the signal next to the soma for sham (black, n = 41) and SE cells (red, n = 39). C. Averaged Ca2+ signal traces next to the soma for sham (black, n = 41), SE[n] (green, n = 17) and SE[s] cells (blue, n = 12). D. Comparison of Ca2+ signal amplitude and decay kinetics measured next to the soma for sham (black, n = 41), SE[n] (green, n = 17) and SE[s] (blue, n = 12); * p<0.05. E. B-AP analysis (ΔF/F in % along the apical dendrite) for SE[n] (green, n = 17) and SE[s] cells (blue, n = 12); lines without symbols represent corresponding data from sham (black) and the parent population of SE cells (red; see panel A). F. Normalized b-AP imaging data for SE[n] (green, n = 17) and SE[s] cells (blue, n = 12); lines without symbols represent corresponding data from sham (black) and the parent population of SE cells (red; see panel B). Note that SE[n] and SE[s] data superimpose with parent SE data when normalized.

