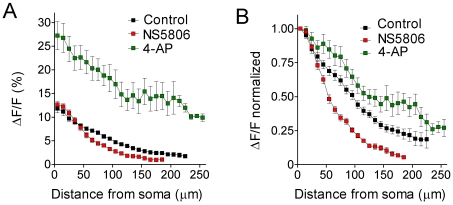
Figure 8. Analysis of pharmacological modulation of b-AP-related Ca2+ signal dynamics.
A. Maximal fluorescence changes (ΔF/F in %) along the apical dendrite (10 µm steps, starting 5 µm from the soma) under control conditions (black; n = 36 continuous data sets averaged), in the presence of NS5806 (red; n = 15 continuous data sets averaged) and in the presence of 4-AP (green; n = 15 continuous data sets averaged). B. B-AP imaging data normalized to the signal next to the soma for control (black, n = 36), NS5806 (red, n = 15) and 4-AP (green, n = 15). Note that the attenuation of the b-AP-induced Ca2+ signal was strengthened in the presence of NS5806 and weakened in the presence of 4-AP.

