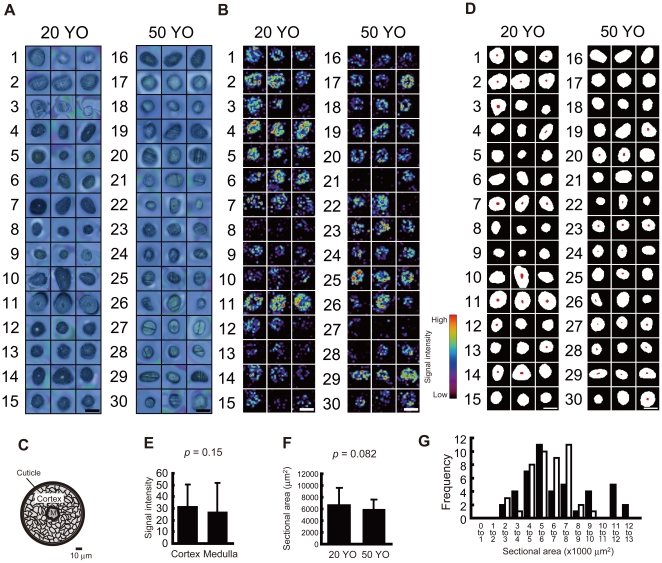
Figure 1. Visualization of molecular distribution in hair cross-sections.
(A) Images of cross-sectioned hairs are shown, numbered as per the subject No. Each of the 3 photographs with the same number is from an independent scalp hair. Scale bar: 100 µm. (B) Ion distribution at m/z 125.99. Scale bar: 100 µm. (C) The principal hair structures are shown. M: hair medulla. (D) ROI corresponding to the hair structures are depicted. White area: cortex. Red area: medulla. Black area: background. Scale bar: 100 µm. (E) The signal intensity at m/z 125.99 in hair cortex and medulla is shown *: p<0.05. (F) Cross-sectional area of hair is shown. (G) A histogram of the cross-sectional area is depicted. Black bar: 20-YO group. White bar: 50-YO group. All values are presented as mean±standard deviation.

