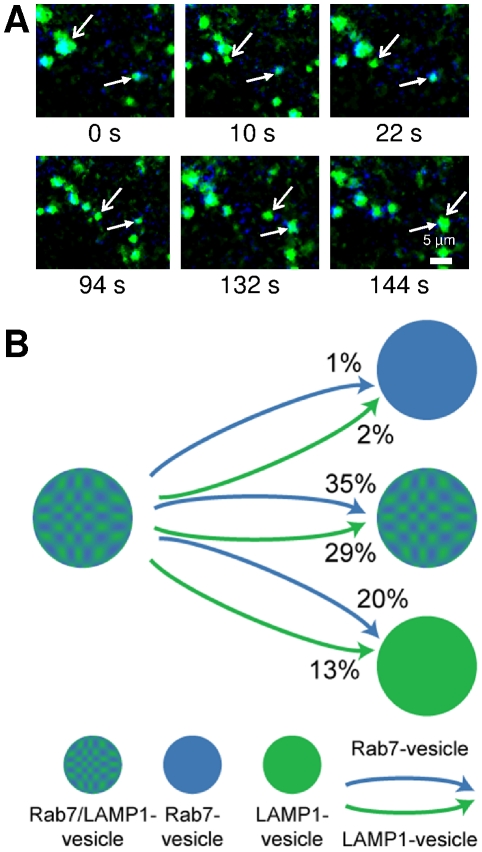
Figure 4. Single particle tracking fluorescence microscopy was used to follow the trajectories of Rab7- and LAMP1-vesicles.
The trajectories of 50 Rab7-vesicles and 50 LAMP1-vesicles in 7 different cells were analyzed. (A) Snapshots of a trajectory obtained from two color live cell imaging experiments. These images show a LAMP1-vesicle (open arrow) split from a Rab7/LAMP1-vesicle, traffic through the cell, and then merge with a Rab7/LAMP1-vesicle (closed arrow). The corresponding movie (Movie S1) is included as supporting information. (B) The majority (89%) of trajectories began with a Rab7- (blue) or LAMP1-vesicle (green) splitting from a Rab7/LAMP1-vesicle (blue-green, patterned). The percentage of each type of event is shown. For example, 1% of Rab7-vesicles that split from a Rab7/LAMP1-vesicle then merged with another Rab7-vesicle.

