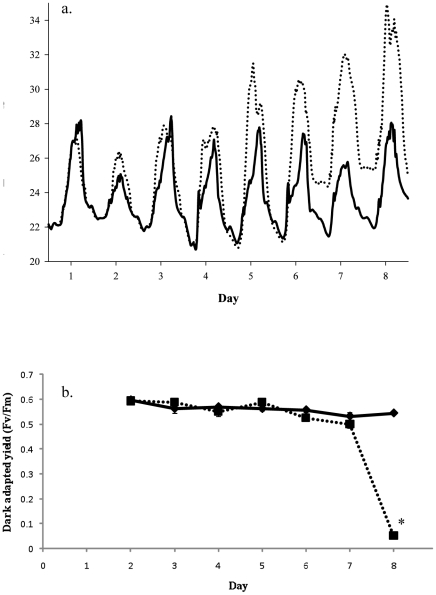
Figure 1. Temperature profile and dark-adapted yield for A. aspera during the course of the experiment.
(a) Temperature represents the average of the three experimental tanks (…) and three control tanks ( ). (b) Dark adapted yield of heated (▪) and control (♦) corals was measured at 18:30 each day after the corals had been dark-adapted for 30 minutes, n = 9, error bars represent standard errors, * represents significant differences between controls and treatments (p<0.05).

