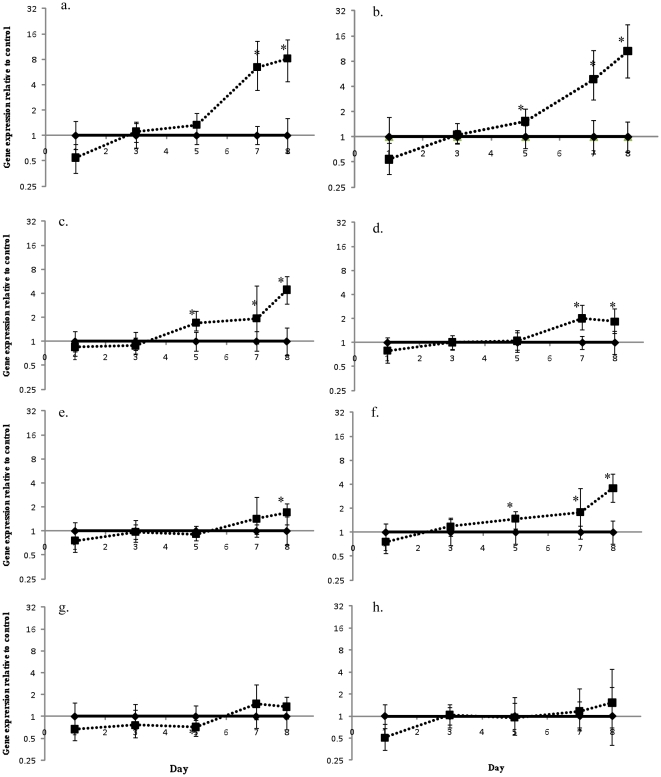
Figure 2. Changes in A. aspera gene expression during a simulated bleaching event.
Changes in gene expression of heated A. aspera nubbins compared to control nubbins on the same day for (a) HSP70, (b) HSP90, (c) GAPDH, (d) α-ketoglutarate dehydrogenase, (e) glycogen synthase, (f) glycogen phosphorylase, (g) glutamine synthetase and (h) malonyl Co-A acyl transferase. Controls (♦) have relative expression values of while heated tanks (▪) are changes in gene expression relative to controls on that day. Error bars represent standard error, n = 6 for each treatment, * represents significant differences between controls and treatments (p<0.05).

