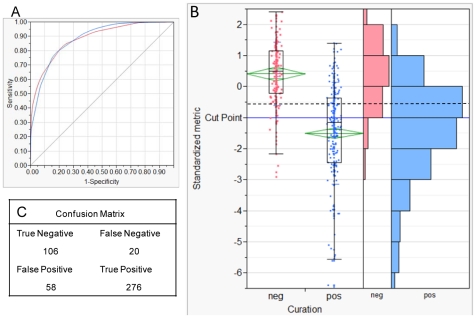
Figure 2. Relationship between MHC binding prediction and curated epitope characterizations.
Panel A. The area under the ROC curve of 0.88 reflects the categorization reliability at the optimum cut-point of −0.53σ chosen by the recursive categorization process. Panel B. The chart shows that the mean of the positive class was approximately −1.5σ (center of the diamond). The mean of the negative class is approximately +0.4σ. The ends of the boxes are the 25th and 75th percentile and the horizontal line in the box is the median. The ends of the lines are the 5th and 95th percentiles of the respective distributions. Many points are plotted on top of each other but the histograms on the right shows the data distribution. A cut-point of −0.53σ was chosen by the recursive categorization process (dotted line). The cutpoint at −1σ (solid line) is a more rigorous threshold which was used as a readily understandable criterion throughout the study. Panel C. The confusion matrix documents agreement and disagreement between predictive and experimental methods.

