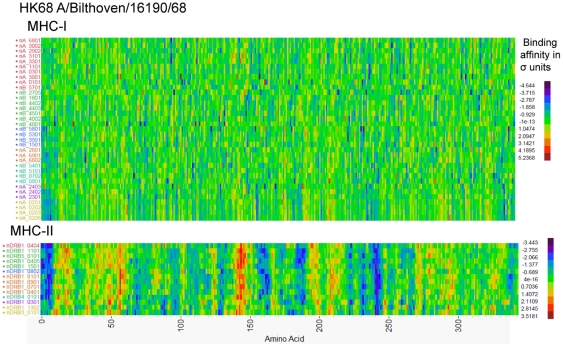
Figure 5. Hierarchical Cluster of predicted MHC-I and MHC-II binding to HA1 from a HK68 cluster representative isolate.
Hierarchical clustering of predicted binding of multiple MHC-I and MHC-II alleles to consecutive peptides in HA1 of Influenza A/Bilthoven/16190/68 was done by the method of Ward using Johnson Sb distribution standardized binding data [42]. The Y-axis lists the MHC alleles. The X-axis shows the protein amino acid positions N-C. Each pixel represents the 9-mer or 15-mer peptide which starts at that amino acid position. The binding data for each HLA was first submitted to principal component analysis and the first principal component was used as an ordering variable. In each case clusters are indicated by the color of the y-axis legend. Comparable plots of binding to HA1 of other cluster representative viruses are shown in Figure S5. The color scale shows the binding affinity as ln(ic50). Purple-blue colors indicate strong binders and red-orange pixels are weak binders.

