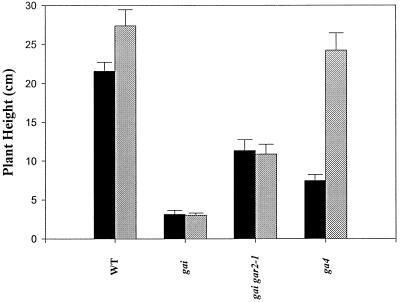
Figure 2.
Comparison of GA response of the wild type (WT), gai, and gai gar2–1. Adult heights (47 d after sowing) of GA3-treated (gray bars; 0.1 mm GA3) and control (black bars) plants are shown. Wild-type and ga4 (GA-deficient mutant) plants were taller after GA treatments, whereas gai and gai gar2–1 were unaffected. Plants were grown in an 18-h photoperiod. Results are presented as means ± se (n = 18–30).

