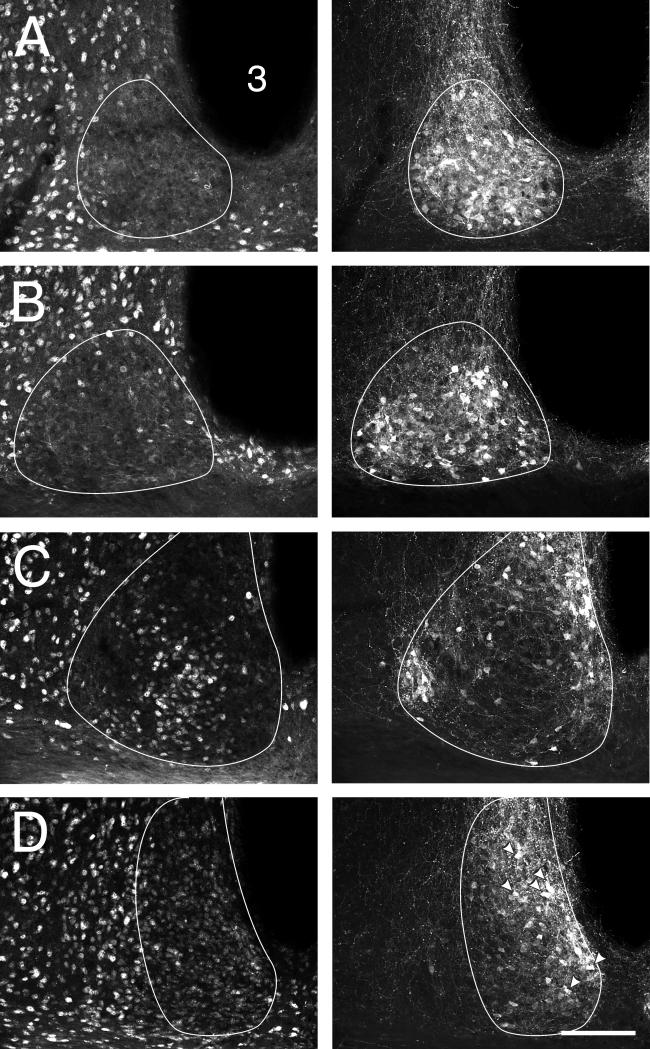
Figure 4.
Distributions of NeuN- (left column) and VP-IR (right column) cells in 4 rostral (A) to caudal (D) levels of mouse SCN. Co-localization of NeuN- and VP-IR only in level D where the two distributions overlap (arrowheads in (D, right column) indicate some of the cells with co-localization). 3 = third ventricle. Bar = 100 μm.

