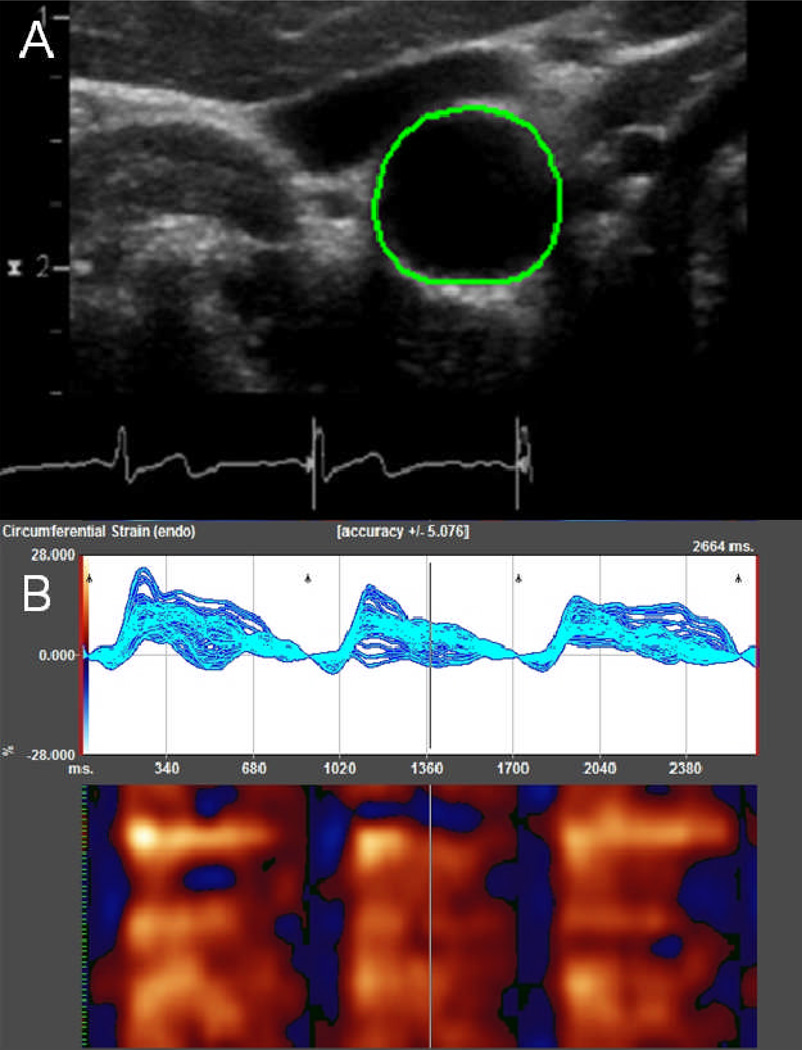
Figure 1. Measuring circumferential carotid arterial strain using speckle-tracking.
Contour generated after manual marking of intima-luminal border of the right distal common carotid artery (A). Strain values depicted by software system over 3 cardiac cycles (B). The top graph shows the change in circumferential strain over time at each of the 48 points along a closed loop contour. The graph below it illustrates a color map representation, with each of the 48 points represented on the y-axis; time, on the x-axis; red, positive strain values; and blue, negative values.

