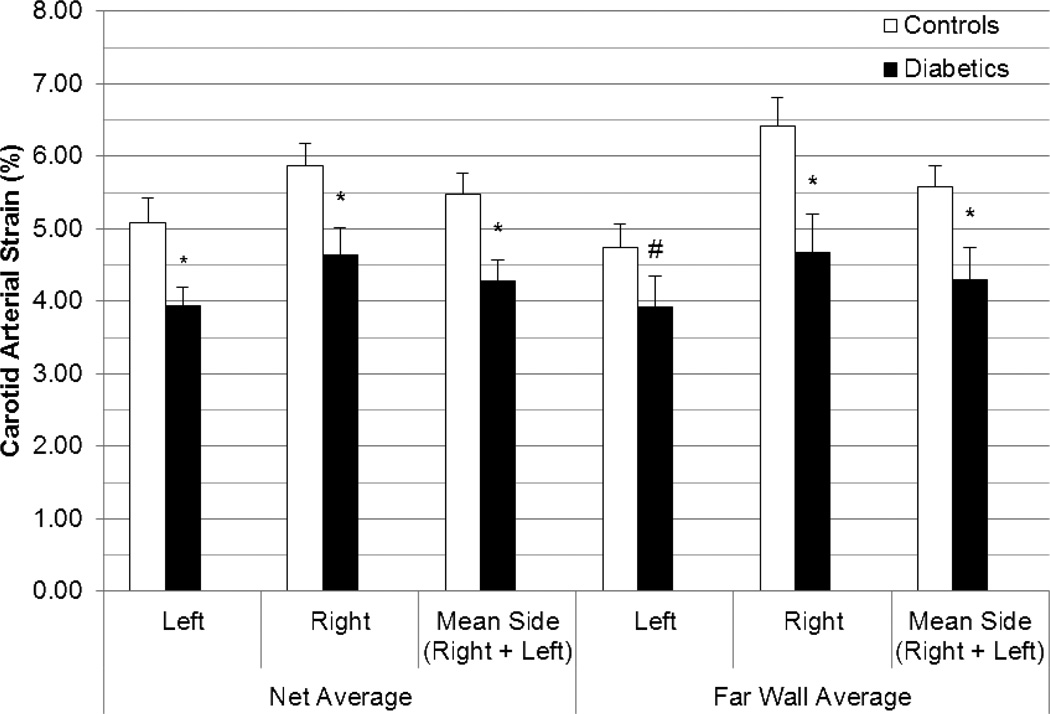
Figure 3. Comparison of peak circumferential carotid arterial strain in controls vs. diabetics by net average and far wall average values.
Strain values listed are means with standard error bars. Tests of comparison were performed using the Wilcoxon rank sum test. (L=Left, R=Right, # p < 0.05, * p <0.001)

