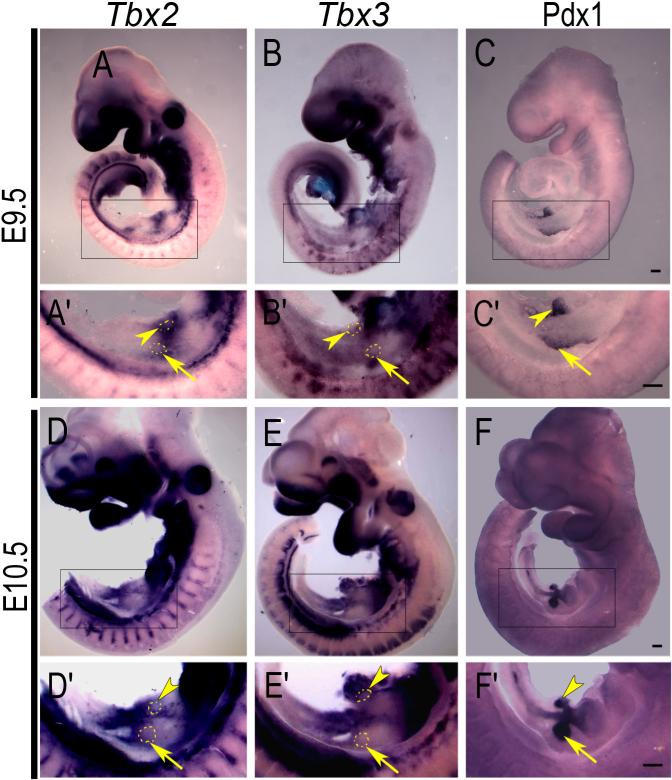
Fig. 1.
Tbx2 and Tbx3 RNA expression at bud stages of pancreas development. Whole-mount ISH was performed for Tbx2 (A, D) and Tbx3 (B, E) on dissected whole embryos at E9.5 and E10.5. Pdx1 expression (C, F) was detected by whole-mount IHC to highlight pancreatic epithelium. Boxed areas in A-F show the pancreatic region at higher magnification in A'-F'. The approximate position of the epithelial buds are marked by dotted lines (A', B', D' and E'). Arrows indicate the dorsal pancreas and arrowheads indicate ventral pancreas. Scale bars in C, C , F and F = 200μm (A- F ).

