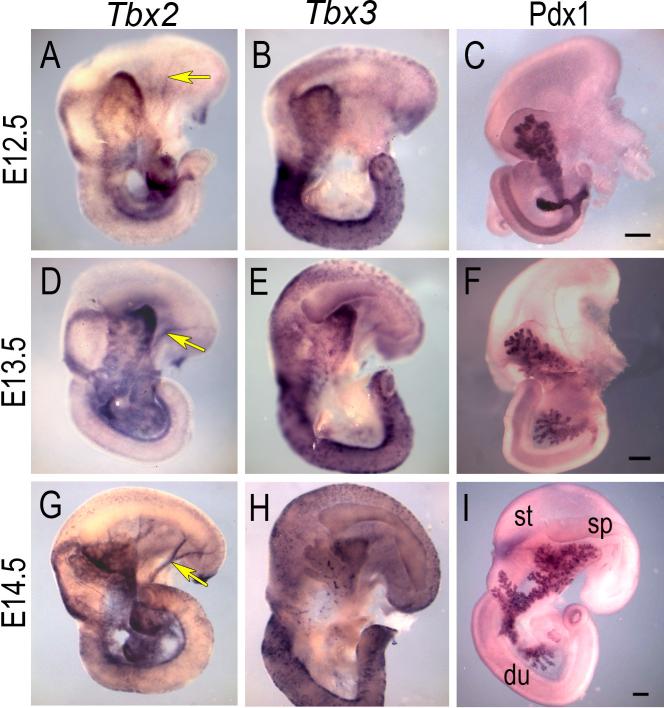
Fig. 2.
Tbx2 and Tbx3 RNA expression in the developing pancreas, E12.5-E14.5. Whole-mount ISH of the pancreas (dorsal view) isolated with stomach (st), duodenum (du), and spleen (sp). Both Tbx2 (A, D, G) and Tbx3 (B, E, H) are expressed in the pancreatic mesenchyme. Pdx1 epithelial expression by whole-mount IHC is shown for comparison (C, F, I). Arrows show Tbx2 expression in the pancreatic vasculature (A, D, G). Scale bars in C, F and I = 200μm (A-I).

