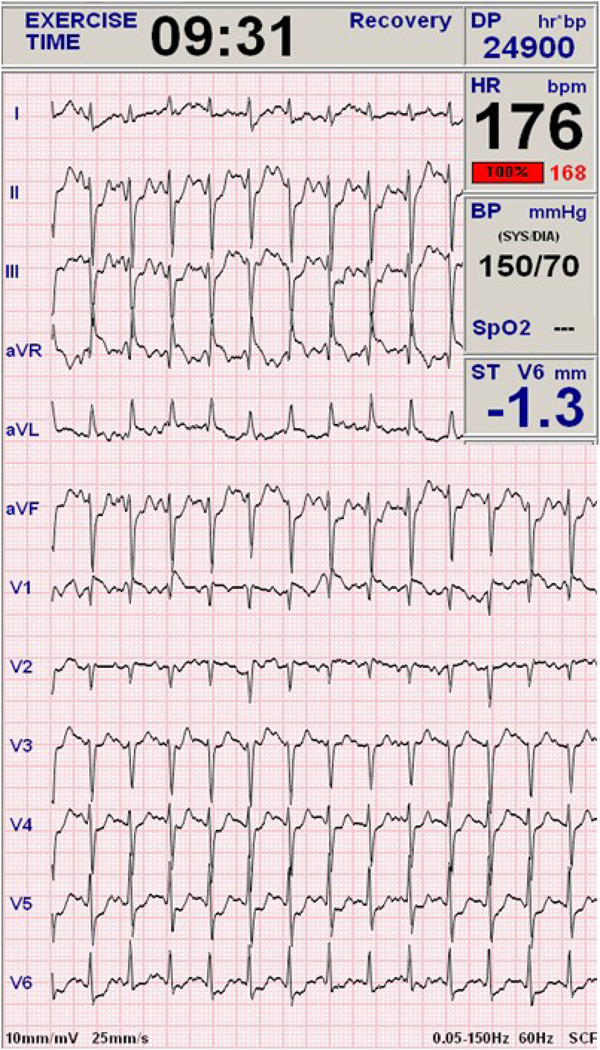
Figure 1. 12-lead ECG Revealing Exercise-Induced Myocardial Ischemia.
This recording was taken at the peak of an exercise-treadmill testing of a 52 year-old healthy male firefighter, non-obese, and non-smoker. The recording shows horizontal ST depression >1mm in V4–V6 that lasted for 3 minutes after stopping the test. The average 24hrs T wave loop complexity ratio obtained from the Holter was 20%.

