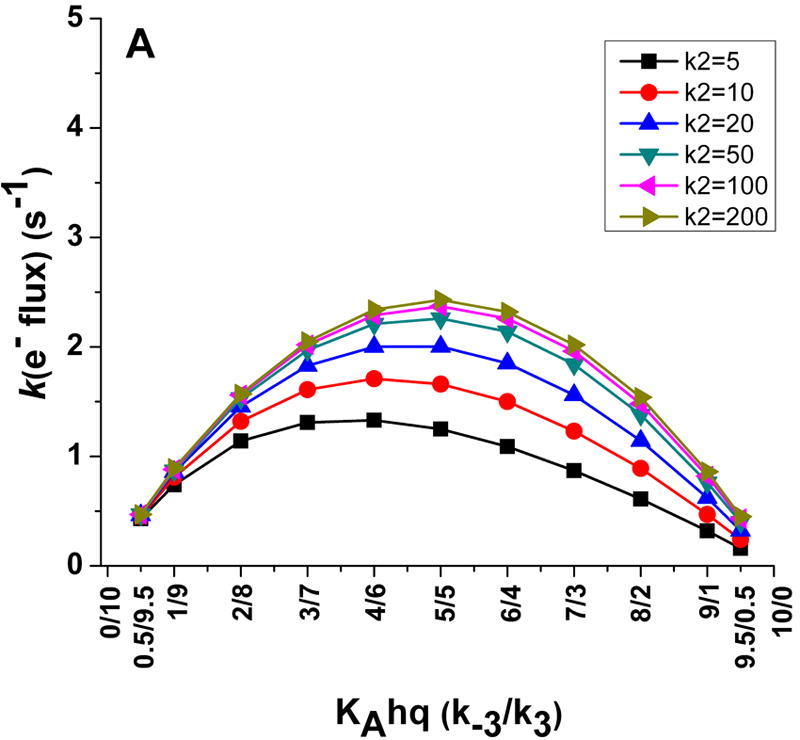
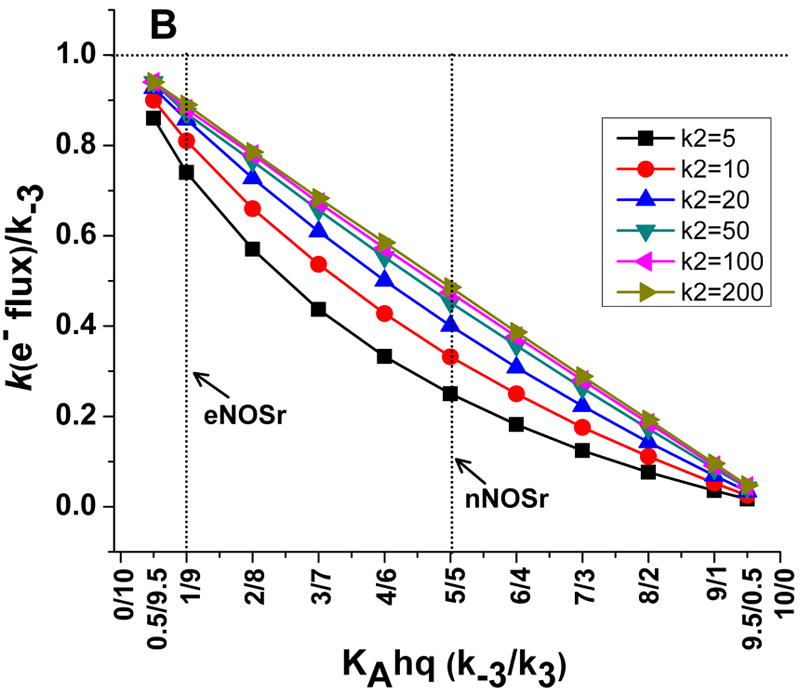
Fig 3. Simulations of the kinetic model showing how electron flux through a dual flavin enzyme may relate to the KAhq setting and the rate of interflavin electron transfer.


Panel A shows the electron flux as a function of KAhq setting at six different interflavin electron transfer rates, while Panel B shows how the electron flux relates to the rate of conformational change at each KAhq and interflavin electron transfer setting. Values for k2, k3, and k-3 are in (s-1).
