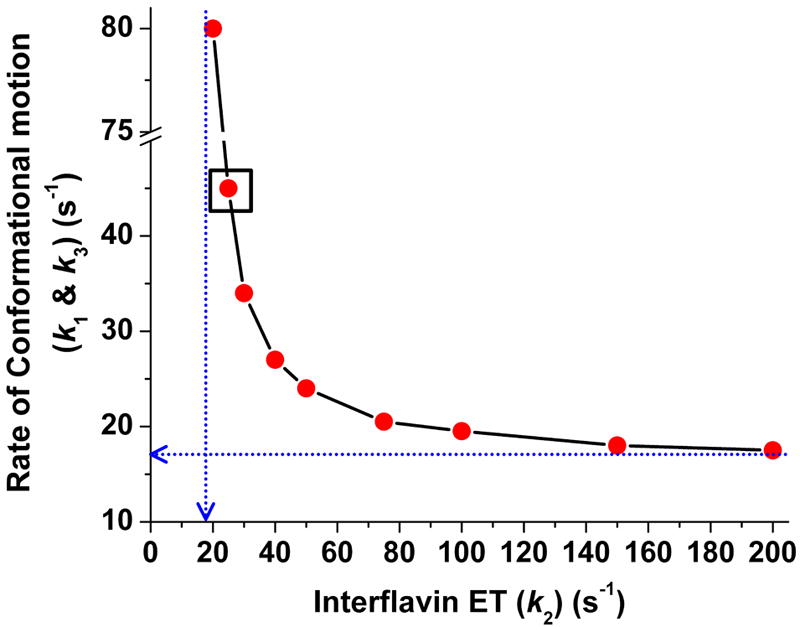
Fig 6. Conformational motion and interflavin electron transfer rate settings that support the observed (8 s-1) electron flux through nNOSr.

Data were obtained from simulations of the kinetic model in Fig. 2. For a given k2 value, rates of conformational motion were screened for a value that yields an electron flux of 8 s-1. Conformational motion rates were set so KAhq = KAsq = 1 and k1 = k-1 = k3 = k-3. Blue dashed lines indicate the lower boundary values for the rates of conformational motion (Y intercept) and interflavin electron transfer (X intercept). Boxed point is the best-fit rate pair for nNOSr.
