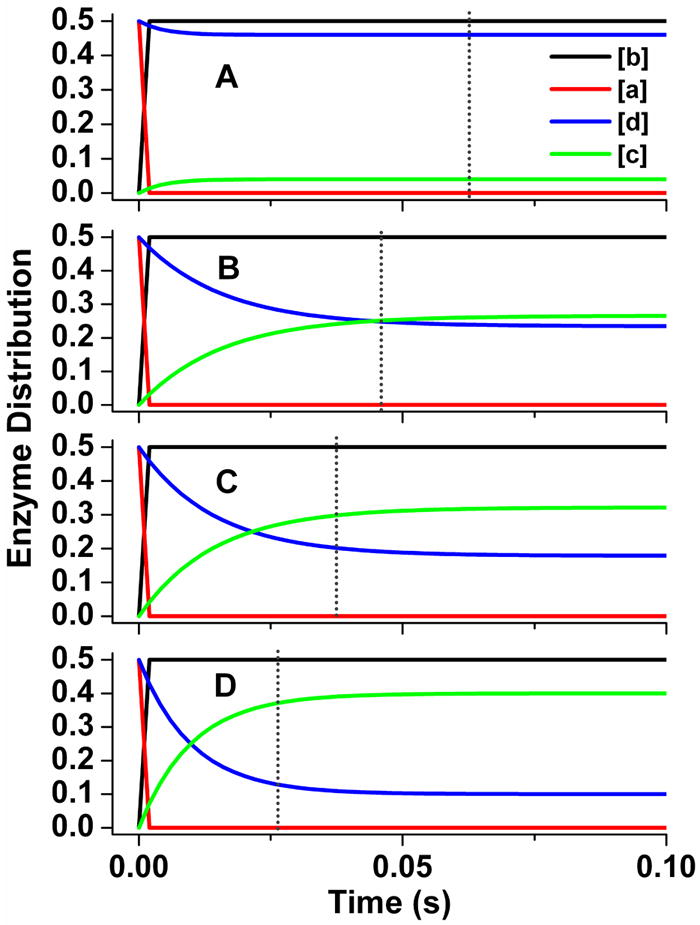
Fig 7. Patterns of enzyme distribution versus time for nNOSr reactions that were simulated using different rate pairings.

Rate pairs of conformational motion and interflavin electron transfer were chosen in each case to simulate an electron flux of 8 s-1. Lines indicate the relative concentrations of each enzyme species a-d (see Fig. 2), with the total enzyme concentration being 1.0 and the concentration of enzyme species d + a being set equal to 1.0 at time = 0 in the simulations. Dotted line marks the time required for nNOSr to reduce one equivalent of cytochrome c. Kinetic settings (s-1) were Panel A: k1 = k-1 = k3 = k-3= 17.5, k2 = 200; Panel B: k1 = k-1 = k3 = k-3= 34, k2 = 30; Panel C: k1 = k-1 = k3 = k-3= 45, k2 = 25; Panel D: k1 = k-1 = k3 = k-3= 80, k2 = 20.
