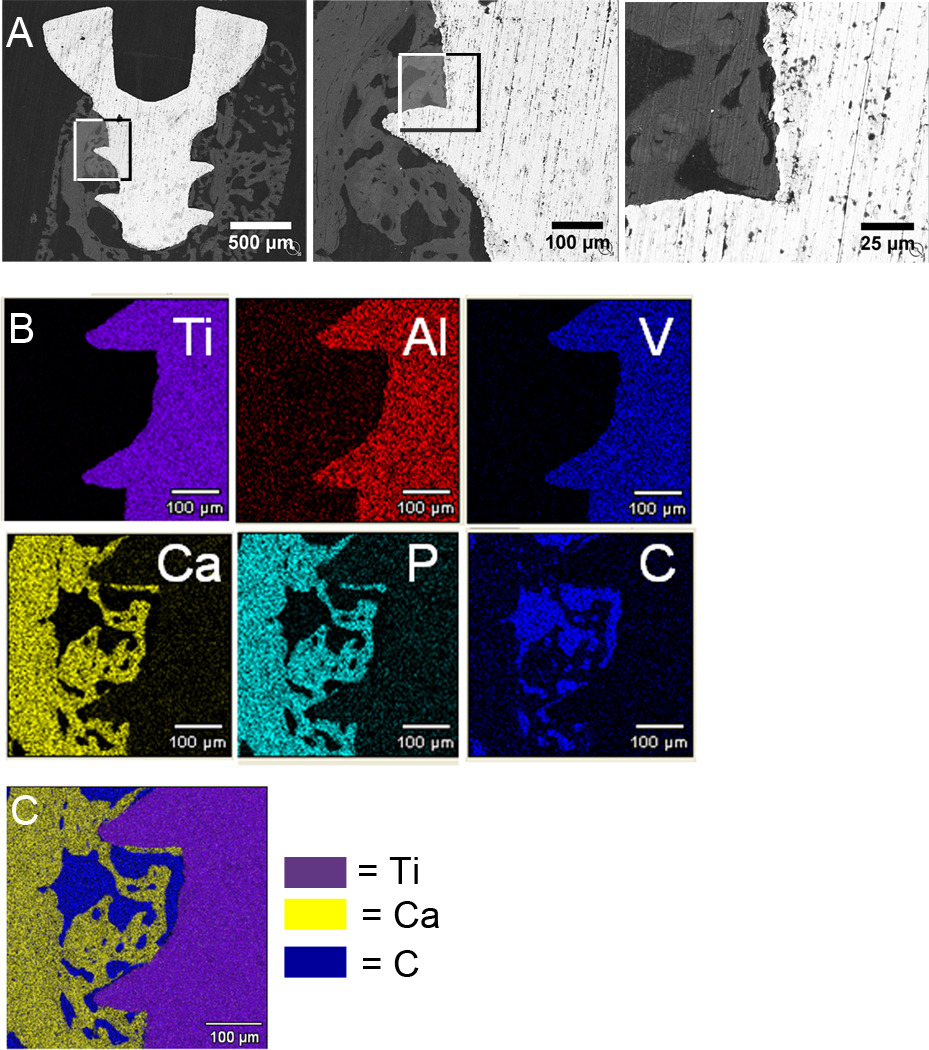
Figure 2. Backscatter Scanning Electron Microscopic Analysis of Osseointegration.
Images at 2 weeks after implantation: bone (white), implant (grey) and marrow cells (black) (A). Boxes indicate areas magnified in next panel. Elemental analysis using x-ray energy dispersive spectroscopy at 2 weeks after implantation (B). Elemental maps of titanium (purple), aluminum (red) and vanadium (blue) are shown in the top panel. Elemental maps of calcium (yellow), phosphorous (aqua) and carbon (blue) are shown in the bottom panel. Merged image of elemental analysis showing titanium, calcium and carbon (C). Similar results were obtained at 5 weeks following implantation. Representative images of n=2.

