Abstract
Background
Repolarization heterogeneity and rate dependency have long been established as factors contributing to arrhythmogenic risk. However there are conflicting observations regarding the nature and extent of ventricular repolarization heterogeneity that complicate understanding of arrhythmogenic mechanisms. In order to explore these disparate findings, we studied ventricular repolarization heterogeneity and rate dependency in a canine, rapid pacing model of heart failure.
Methods and Results
We studied ventricular repolarization heterogeneity and rate dependency in 10 canine hearts (5 normal and 5 following one month of rapid pacing at 240 beats per minute) by analyzing 64 body surface electrocardiograms, 64 epicardial and 190 intramural plunge electrograms (EGs). We estimated mean ventricular depolarization and repolarization times from R and T wave peaks of the RMS ECG (body surface) and local depolarization and repolarization times using activation-recovery interval (ARI) methods from recordings obtained during a range of fixed rate pacing. In addition, we estimated local epicardial and transmural gradients of ARIs to assess cardiac locations of greatest spatial repolarization heterogeneity. We compared changes in repolarization at different rates between normal and heart failure hearts. Findings documented prolongation of repolarization, repolarization rate dependency, and increased repolarization gradients in the heart failure hearts compared to control as observed from body surface, epicardial and transmural measurements. Maximum local epicardial and intramural ARI gradients were comparable both in heart failure and control hearts. Intramural ARI distributions tended to be more irregular in the heart failure hearts compared to the systematic epicardium to endocardium ARI increase observed in control animals.
Conclusions
This study documented prolongation of repolarization, increase in both epicardial and transmural repolarization gradients, and irregularity of transmural distribution in a rapid pacing canine model of heart failure compared to control animals. The findings support previously published results of increased repolarization heterogenetity and repolarization prolongation observed in rapid pacing models of heart failure. New findings are the irregularity of transmural heterogenetity and the ability of noninvasive RMS-ECG R-T intervals to estimate mean ventricular repolarization duration in the setting of rapid pacing models of heart failure. These findings suggest increased arrhythmogenic risk in this model and potentially in patients with heart failure.
Keywords: electrophysiology, repolarization heterogeneity, dispersion, mapping, repolarization rate dependency, repolarization gradients
Introduction
Increased repolarization heterogeneity and elevated repolarization rate dependency (restitution) have long been associated with increased arrhythmogenic risk. The seminal experimental study of Han and Moe documented the presence and extent of nonuniformity of excitability in normal hearts1. Many experimental and simulation studies since have provided evidence that spatial heterogeneity of repolarization provides a substrate for reentrant arrhythmias and that an increase in the disparity or dispersion of repolarization leads to increased likelihood of arrhythmia. Importantly, there is renewed interest in developing clinically viable electrocardiographic measurements to assess and monitor changes in repolarization heterogeneity for purposes of identifying patients at arrhythmogenic risk or tracking efficacy of pharmacological therapy. The QTc has been the primary tool for assessing such risk as it signifies a rate corrected index of repolarization duration, but it does not relate directly to repolarization heterogeneity (dispersion). QT dispersion (QTd) offered the possibility of identifying such dispersion but it’s utility has not proved to be consistent and there is evidence that the measurement does not, in fact, reflect repolarization dispersion2. Results using wedge preparations of cardiac muscle have suggested that the interval between the peak and end of the T wave (Tpk-Tend) may reflect transmural dispersion of repolarization3, 4. However, studies of intact hearts dispute this finding5. Studies on intact hearts have also provided evidence that the width of the root-mean-square ECG T wave yields a global estimate of the range (dispersion) of repolarization times6.
In spite of the fact that these studies have provided encouraging results, there are conflicting conclusions about the nature and extent of repolarization disparity. Studies using the wedge preparation have shown large transmural gradients of repolarization when compared to epicardial repolarization gradients in the same piece of tissue. In contrast, recent studies using intact hearts suggest that epicardial (base-to apex) gradients and ranges of repolarization time and duration are substantially larger than those measured transmurally7.
In the present study, we present directly measured data from intact canine hearts that support the contention that epicardial or tangential and transmural gradients of repolarization timing and duration are comparable.
Methods and Procedures
Experimental Preparation
Ten mongrel canines (five control animals and five animals in the heart failure animals) were obtained by the University of Utah Animal Research Center and managed under AHA standards for the care and use of animals in research. For acute studies in both groups, animals were lightly anesthetized with Brevitol, intubated, mechanically ventilated, and maintained under anesthesia with Halothane. A femoral intravenous line was inserted to maintain fluids via a normal saline drip. Prior to opening the chest, 64 body surface ECGs were recorded during sinus rhythm. For the acute studies in both control and heart failure animals, hearts were exposed using an anterior midline thoracotomy and suspended in a pericardial cradle. After applying atrial and ventricular epicardial bipolar pacing electrodes, the sinus node was clamped to allow pacing at longer cycle lengths than that for resting sinus rhythm. Epicardial sock and needle-mounted plunge electrode arrays were applied and bipolar pacing wires were attached to the right atrial appendage as well as right and left ventricular free wall epicardial surfaces (see below for all electrode configurations). The chest cavity was lightly covered to maintain a constant temperature. Level of anesthesia was monitored by corneal reflex and adjusted accordingly. Fixed rate pacing with stimuli of 2 ms duration and voltage set at 1.5 times capture threshold was initiated and maintained for two minutes after which ten second recordings were acquired for each cycle length.
The five heart failure animals scheduled for rapid pacing were implanted with a programmable pacemaker, had RV pacing leads inserted under fluoroscopy using conventional methods, and body surface recordings obtained at cycle lengths between 300ms and the maximum CL at which capture could be maintained. Following pacemaker implantation and body surface potential recording at several cycle lengths, the animals were allowed to recover, paced continuously at 240 beats per minute, and boarded for approximately one month.
Electrodes and Recordings
Three electrode arrays were used for these studies. For body surface recordings on both control and heart failure animals, an 8 × 8 array of unipolar needle electrodes were inserted subcutaneously on the anterior thorax of each animal. Electrode spacing varied but the array was uniformly distributed horizontally between the sternal notch and the ziphod and vertically between right and left lateral axilla. An epicardial sock array of 64 unipolar electrodes fabricated from .003 inch diameter silver wires, stripped of insulation at the tips and tied into a nylon mesh was pulled over each canine heart. Electrodes were distributed over the right and left ventricles at roughly 1.0 cm spacing. Nineteen 10-pole unipolar plunge electrodes were applied through the sock array and into the myocardium for intramural recordings. Electrodes were chlorided to minimize polarization effects. Thirteen LV (1.6 mm spacing) and six RV (1.0 mm spacing) plunge electrodes were inserted perpendicular to the epicardium in left and right ventricular free walls, respectively. A chest lead was used as the recording reference for all 64 epicardial sock and 190 needle unipolar electrodes.
All recordings were made using a custom recording system featuring continuous, simultaneous sampling and digitizing of up to 512 channels of data at a 1000 Hz sample rate. The system digitized data to 12 bits using variable gain amplifiers to maximize dynamic range and has a bandwidth of .03 – 500 Hz. Hearts were paced at cycle lengths from 300 ms to the longest cycle length to maintain stable capture and ten second recordings made after pacing at each rate for two minutes to allow rate adaption of repolarization.
Measurements and Analyses
For body surface assessment of repolarization, the root-mean-square (RMS) of all 64 gain and baseline adjusted electrocardiograms from one beat were used to estimate times of mean ventricular depolarization (time of R peak) and mean repolarization (time of T peak). The R-T interval of the RMS ECG has been shown to be a robust estimate of mean ventricular ARI8, 9 and consequently action potential duration (APD).
For epicardial and intramural assessment of repolarization, each electrogram (EG) was analyzed using custom software to determine local depolarization and repolarization times using ARI methodology10–12. Briefly, depolarization (activation) and repolarization times (ATs and RTs) were determined as times of minimum dv/dt in the QRS and maximum dv/dt near the peak of the T wave, respectively. ARIs (difference between AT and RT) at each electrode have been shown to be robust estimates of local action potential duration. Measurements were reviewed and manually edited if necessary.
For plunge electrode recordings, we displayed the ten EGs from distal (endocardium) to proximal (epicardium) ends of each needle-mounted array to ensure that each pole of the array was in myocardium. We identified intramyocardial potentials as those having a sharp intrinsic deflection preceded by a discernable positive deflection, and classified as cavitary those EGs that lacked both a sharp intrinsic deflection and a preceding positive deflection. All cavitary measurements were discarded from future analyses.
For both epicardial and plunge electrode data, maximum local ARI gradients were estimated using differences in ARIs from adjacent electrodes divided by their interelectrode distance.
Evidence of heart failure
In order to determine that one month of rapid pacing had, in fact, altered heart structure and function, cardiac echocardiograms of the heart failure animals were obtained prior to and one month following pacing. These images were assessed by a trained cardiologist who compared the pre- and post pacing images.
Statistical Analysis
Cumulative probability distribution functions (CPDFs) were plotted to illustrate differences between group variables. The Kolmogorov-Smirnov test of significant difference between groups was used as it does not depend on the actual distributions of variables nor require the number of samples in each group to be the same. In addition, histograms of variables were used to illustrate characteristic differences between groups.
Results
All heart failure animals showed varying but clear evidence of dilatation following one month of rapid pacing. Features included clearly enlarged ventricular volume and to a lesser extent, reduced wall thickness. There was no clear evidence of hypertrophy (increased wall thickness).
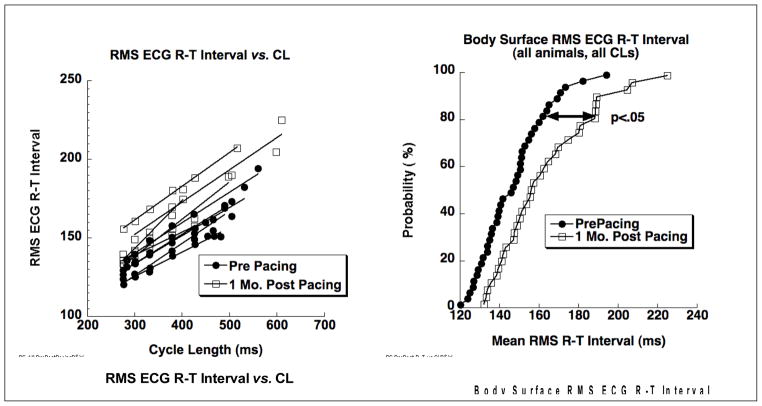
Data in Figure 1 show repolarization changes observed from the body surface recordings in all five heart failure animals. On the left are repolarization rate dependency curves of R-T interval versus cycle length showing clear prolongation of RMS ECG R-T intervals at all cycle lengths following one month of pacing. On the right are cumulative probability distribution functions (CPDFs) for pre- and post-pacing R-T intervals measured from the RMS ECG from all heart failure animals and at all cycle lengths. These distributions compare estimated mean ventricular APDs from pre- and post pacing measurements from the body surface. Kolmogorov-Smirnov statistics document a significant increase (p < .05) of about 20 ms in the R-T intervals following one month of pacing.
Figure 1.
Repolarization changes observed from the body surface ECGs in the five heart failure animals. On the left are repolarization rate dependency curves of RMS ECG R-T intervals versus cycle length. Lines connect measurements for each animal for baseline (filled circles) and one month post pacing (filled squares). On the right are cumulative probability distribution functions of RMS ECG R-T intervals for baseline (filled circles) and one month post pacing (open squares) showing a significant (p < .05) increase in R-T intervals following one month of rapid pacing.
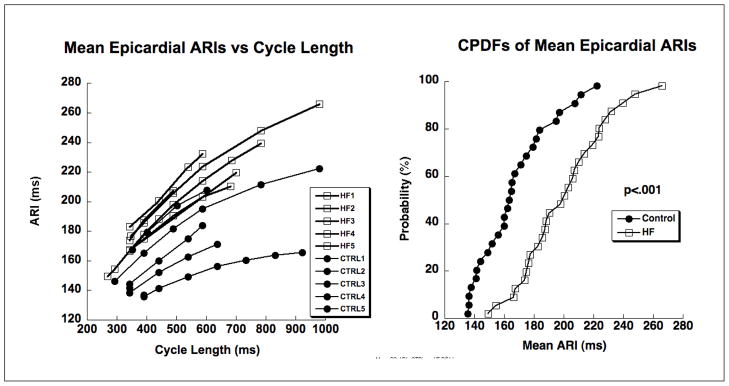
Figure 2 shows findings of epicardial repolarization change in the five heart failure animals compared to the five control animals. The repolarization rate dependency curves on the left clearly show increased prolongation of ARIs following rapid pacing and the cumulative probability distribution functions on the right show significant (p < .001) prolongation of ARIs following pacing. Note that the repolarization rate dependency curves for the heart failure animals from the body surface (Figure 1, left) and those determined from direct cardiac measurements (Figure 2, left) are comparable for the 300–600 range of cycle lengths for which data existed in both states. In addition to prolonged repolarization, the rate dependency curves are qualitatively steeper (greater slope) following one month of pacing compared to baseline.
Figure 2.
Epicardial repolarization data from five control animals (filled circles) and five heart failure animals (filled squares). On the left are repolarization rate dependency curves of mean epicardial ARI versus cycle length, one curve for each animal obtained during the acute studies. On the right are cumulative probability distribution functions (CPDFs) for all animals and all cycle lengths for control animals (filled circles) and heart failure animals (open squares). Each point represents data from one animal and at one of the rates.
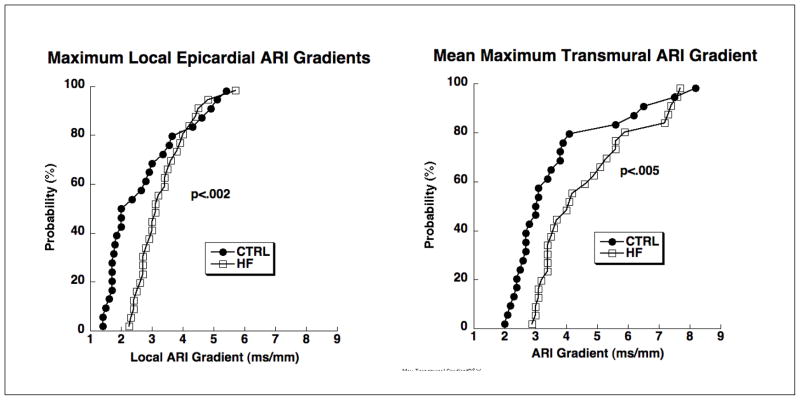
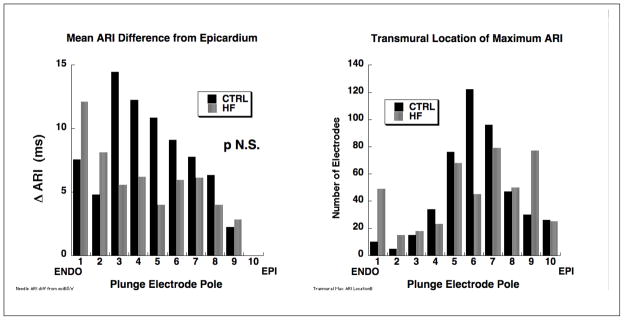
Data in Figure 3 show significantly greater maximum epicardial and transmural ARI gradients in heart failure animals than in control with slightly greater maximum gradients for transmural compared to epicardial regions for both control and heart failure animals. The histograms in Figure 4 compare characteristics of transmural repolarization heterogeneity between control and heart failure animals. The left panel shows systematic and progressively longer mean ARIs from epi-to endocardium for control animals compared to a more uniform distribution for heart failure animals. Maximum mean ARI differences were less than 20 ms compared to epicardium. The right panel documents the location of transmural ARI maxima and shows a tendency for mid-wall locations to dominate with a more irregular distribution for heart failure animals compared to a systematic increase in ARI from epicardium to endocardium observed in the control animals.
Figure 3.
CPDFs of epicardial (left panel) and transmural (right panel) ARI gradients from control animals (filled circles) and heart failure animals (open squares) and for all rates. Each point in the left hand graph represents the maximum local (adjacent electrodes approximately 1 cm apart) epicardial gradient from one animal at one rate. Each point in the right hand graph represents the mean (across all needles) maximum transmural gradient from one animal at one rate.
Figure 4.
Histograms comparing transmural ARI heterogeneity in control and heart failure animals. The left panel shows systematically longer ARIs from epi- to subendocardium in control (solid black bars) with a more uniform and spotty distribution for heart failure animals (gray bars). The right panel shows that for both control and heart failure animals, maximum ARIs tend to be mid-wall but with a more “spotty” distribution for the heart failure animals compared to control.
Discussion
Data reported in this study corroborate findings from others documenting comparable epicardial and transmural ventricular repolarization gradients in normal canine hearts and also supports previous findings of prolonged repolarization and increased repolarization gradients mid wall compared to endo- or epicardium5,7 but not to the extent reported for M-cell data obtained from wedge preparation3,4. Findings of repolarization prolongation and altered transmural gradients also parallel findings by Lacroix et al. in their study of porcine left ventricles following fourteen days of rapid pacing13.
The first new finding reported herein is that the repolarization rate dependency curves generated from noninvasively measured R-T intervals derived from the RMS ECG compare very favorably with those obtained directly from epicardial and transmural measurements. That is, the mean R-T intervals of the RMS-ECG closely reflect the mean ARIs determined from the directly measured epicardial and transmural data. This suggests the potential utility of the RMS-ECG as a simple, noninvasive measurement to assess mean ventricular APD and its dynamics.
The second result is that, in a rapid pacing canine model of heart failure, repolarization rate dependency curves become more elevated and qualitatively steeper, supporting previous findings, and that repolarization gradients, both epicardial and transmural, become larger compared to baseline conditions, a new finding. These findings can, perhaps, be explained in part by the prolongation of APDs associated with cardiac memory14, 15, or perhaps by stretch induced remodeling16, or both.
Finally, the character of transmural repolarization heterogeneity shows a systematic increase of ARIs (APD) from epi- to endocardium in control animals in contrast to a more irregular distribution of ARIs for the heart failure animals. This suggests that, at least in this animal mode of heart failure, remodeling may not be a homogeneous process that uniformly alters structure but rather introduces heterogeneity of both structure and function.
Conclusions
We have presented data that document changes in ventricular repolarization rate dependency, heterogeneity and gradients in a canine rapid pacing model of heart failure. Findings corroborate published data suggesting comparable maximum epicardial and transmural repolarization heterogeneity and gradients in intact normal hearts. As with previous reports in normal hearts, mid-wall repolarization was prolonged compared to endo- and epicardium although not to the extent found in wedge preparations. Results that rapid pacing induced heart failure increased repolarization duration and gradients, both epicardial and transmural, support previous published data, but a new finding suggests that this animal model produces an irregular distribution of repolarization compared to control suggesting that pacing induced remodeling is a highly heterogeneous process. Finally, body surface assessment of repolarization via RMS ECG measurements of R-T intervals closely reflects directly measured myocardial repolarization and its change following one month of rapid pacing. Given that the RMS ECG R-T interval reflects mean ventricular ARI (APD), this offers an alternative to QT that reflects the longest possible range of repolarization duration.
Acknowledgments
This work was supported by an NIH program project grant, P-50 HL52338. The authors are grateful to Ms. Jayne Davis for her expert surgical skills and to Dr. Philip Ershler for his assistance in managing data acquisition.
Footnotes
Publisher's Disclaimer: This is a PDF file of an unedited manuscript that has been accepted for publication. As a service to our customers we are providing this early version of the manuscript. The manuscript will undergo copyediting, typesetting, and review of the resulting proof before it is published in its final citable form. Please note that during the production process errors may be discovered which could affect the content, and all legal disclaimers that apply to the journal pertain.
References
- 1.Han J, Moe GK. Nonuniform Recovery of Excitability in Ventricular Muscle. Circ Res. 1964;14:44–60. doi: 10.1161/01.res.14.1.44. [DOI] [PubMed] [Google Scholar]
- 2.Lux RL, Fuller MS, MacLeod RS, Ershler PR, Green LS, Taccardi B. QT interval dispersion: dispersion of ventricular repolarization or dispersion of QT interval? J Electrocardiol. 1998;30 (Suppl):176–180. doi: 10.1016/s0022-0736(98)80071-x. [DOI] [PubMed] [Google Scholar]
- 3.Shimizu W. Effects of sympathetic stimulation on various repolarization indices in the congenital long QT syndrome. Ann Noninvasive Electrocardiol. 2002;7(4):332–342. doi: 10.1111/j.1542-474X.2002.tb00182.x. [DOI] [PMC free article] [PubMed] [Google Scholar]
- 4.Yan GX, Antzelevitch C. Cellular basis for the normal T wave and the electrocardiographic manifestations of the long-QT syndrome. Circulation. 1998;98(18):1928–1936. doi: 10.1161/01.cir.98.18.1928. [DOI] [PubMed] [Google Scholar]
- 5.Opthof T, Coronel R, Wilms-Schopman FJ, Plotnikov AN, Shlapakova IN, Danilo P, Jr, Rosen MR, Janse MJ. Dispersion of repolarization in canine ventricle and the electrocardiographic T wave: Tp-e interval does not reflect transmural dispersion. Heart Rhythm. 2007;4(3):341–348. doi: 10.1016/j.hrthm.2006.11.022. [DOI] [PubMed] [Google Scholar]
- 6.Lux RL, Gettes LS, Mason JW. Understanding proarrhythmic potential in therapeutic drug development: alternate strategies for measuring and tracking repolarization. J Electrocardiol. 2006;39(4 Suppl):S161–164. doi: 10.1016/j.jelectrocard.2006.05.020. [DOI] [PubMed] [Google Scholar]
- 7.Opthof T, Coronel R, Janse MJ. Is there a significant transmural gradient in repolarization time in the intact heart?: Repolarization Gradients in the Intact Heart. Circ Arrhythm Electrophysiol. 2009;2(1):89–96. doi: 10.1161/CIRCEP.108.825356. [DOI] [PubMed] [Google Scholar]
- 8.Fuller MS, Sandor G, Punske B, Taccardi B, MacLeod RS, Ershler PR, Green LS, Lux RL. Estimates of repolarization dispersion from electrocardiographic measurements. Circulation. 2000;102(6):685–691. doi: 10.1161/01.cir.102.6.685. [DOI] [PubMed] [Google Scholar]
- 9.Fuller MS, Sandor G, Punske B, Taccardi B, MacLeod RS, Ershler PR, Green LS, Lux RL. Estimates of repolarization and its dispersion from electrocardiographic measurements: direct epicardial assessment in the canine heart. J Electrocardiol. 2000;33(2):171–180. doi: 10.1016/s0022-0736(00)80073-4. [DOI] [PubMed] [Google Scholar]
- 10.Millar CK, Kralios FA, Lux RL. Correlation between refractory periods and activation-recovery intervals from electrograms: effects of rate and adrenergic interventions. Circulation. 1985;72(6):1372–1379. doi: 10.1161/01.cir.72.6.1372. [DOI] [PubMed] [Google Scholar]
- 11.Haws CW, Lux RL. Correlation between in vivo transmembrane action potential durations and activation-recovery intervals from electrograms. Effects of interventions that alter repolarization time. Circulation. 1990;81(1):281–288. doi: 10.1161/01.cir.81.1.281. [DOI] [PubMed] [Google Scholar]
- 12.Ejima J, Martin D, Engle C, Sherman Z, Kunimoto S, Gettes LS. Ability of activation recovery intervals to assess action potential duration during acute no-flow ischemia in the in situ porcine heart. Experimental Cardiology Group, University of North Carolina at Chapel Hill. J Cardiovasc Electrophysiol. 1998;9(8):832–844. doi: 10.1111/j.1540-8167.1998.tb00123.x. [DOI] [PubMed] [Google Scholar]
- 13.Lacroix D, Gluais P, Marquie C, D’Hoinne C, Adamantidis M, Bastide M. Repolarization abnormalities and their arrhythmogenic consequences in porcine tachycardia-induced cardiomyopathy. Cardiovasc Res. 2002;54(1):42–50. doi: 10.1016/s0008-6363(02)00236-5. [DOI] [PubMed] [Google Scholar]
- 14.Janse MJ, Sosunov EA, Coronel R, Opthof T, Anyukhovsky EP, de Bakker JM, Plotnikov AN, Shlapakova IN, Danilo P, Jr, Tijssen JG, Rosen MR. Repolarization gradients in the canine left ventricle before and after induction of short-term cardiac memory. Circulation. 2005;112(12):1711–1718. doi: 10.1161/CIRCULATIONAHA.104.516583. [DOI] [PubMed] [Google Scholar]
- 15.Coronel R, Opthof T, Plotnikov AN, Wilms-Schopman FJ, Shlapakova IN, Danilo P, Jr, Sosunov EA, Anyukhovsky EP, Janse MJ, Rosen MR. Long-term cardiac memory in canine heart is associated with the evolution of a transmural repolarization gradient. Cardiovasc Res. 2007;74(3):416–425. doi: 10.1016/j.cardiores.2007.02.024. [DOI] [PubMed] [Google Scholar]
- 16.Obreztchikova MN, Patberg KW, Plotnikov AN, Ozgen N, Shlapakova IN, Rybin AV, Sosunov EA, Danilo P, Jr, Anyukhovsky EP, Robinson RB, Rosen MR. I(Kr) contributes to the altered ventricular repolarization that determines long-term cardiac memory. Cardiovasc Res. 2006;71(1):88–96. doi: 10.1016/j.cardiores.2006.02.028. [DOI] [PubMed] [Google Scholar]


