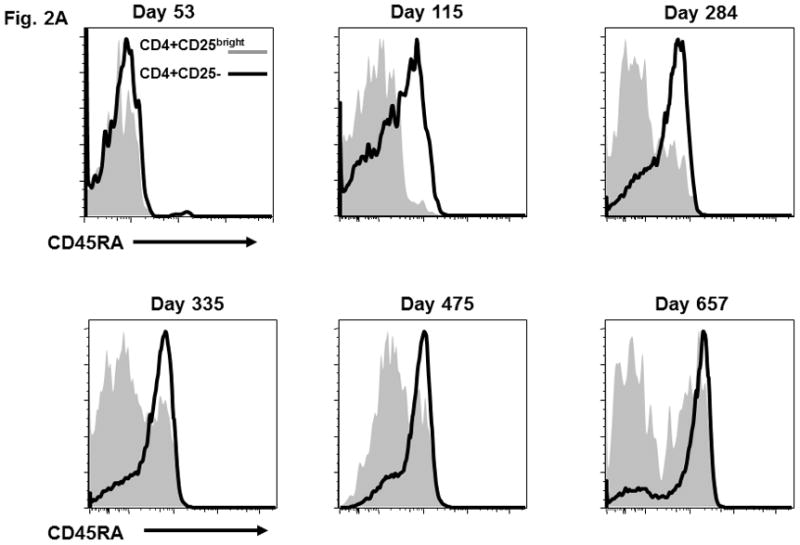
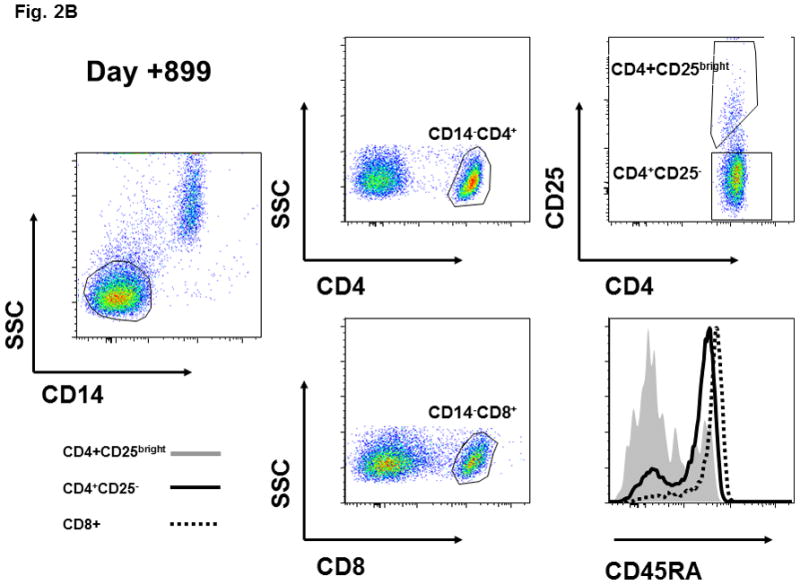
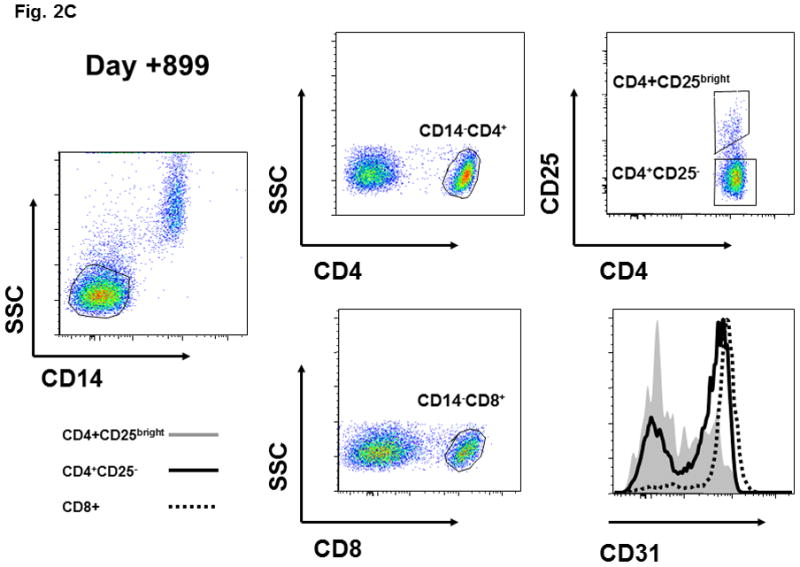
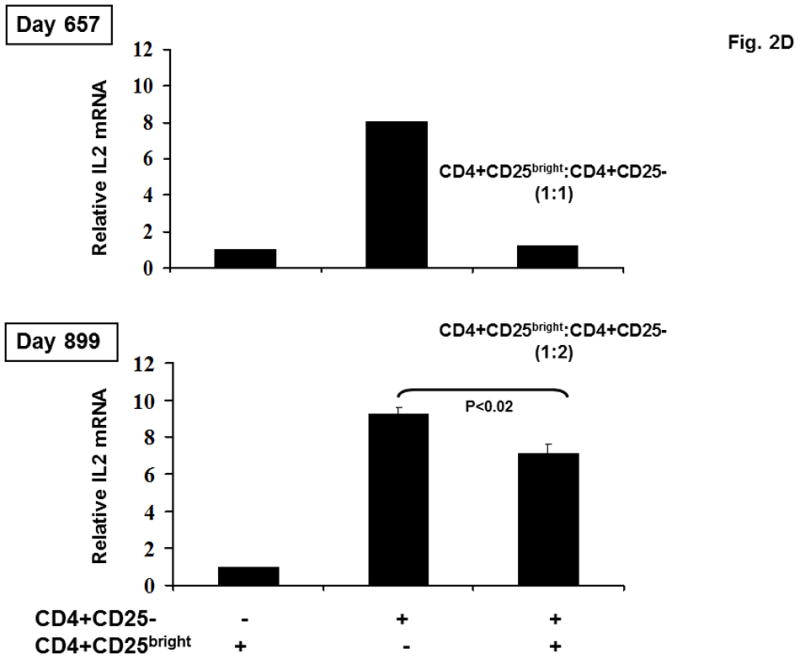
Figure 2. CD45RA and CD31 expression on CD4+CD25-, CD4+CD25bright, and CD8+ T cell populations and the functional activity of sorted CD4+CD25bright T cells.


(A) CD45RA status of patient CD4+CD25bright (shaded area) and CD4+CD25- (solid line) T cells is shown at various times after HSCT. (B) CD45RA expression on day +899 is shown for the CD4+CD25bright (shaded area), CD4+CD25− (solid line), and CD8+ (dotted line) T cell populations. The gating strategy excluded CD14+ monocytes and positively gated either CD4+ or CD8+ T cells. The CD4+CD25− and CD4+CD25bright populations were gated as shown. (C) The gating strategy and CD31 expression is depicted for the CD4+CD25bright (shaded area), CD4+CD25− (solid line), and CD8+ (dotted line) T cell populations on day +899. (D) CD14−CD4+CD25− and CD14−CD4+CD25bright T cells were sorted as described and immediately assayed for functional capability. Relative IL2 mRNA levels were measured after a 6-hour in vitro stimulation with anti-CD3, anti-CD28, and anti-CD2 conjugated beads either alone or in co-culture at the indicated ratios. ABL1 was used as the endogenous control, IL2 from CD14−CD4+CD25bright cells as the calibrator, and CD14-CD4+CD25− as the positive control. Sufficient cells were available for stimulation cultures to be done in triplicate on day +899 and statistical significance by paired t-test analysis is shown.
