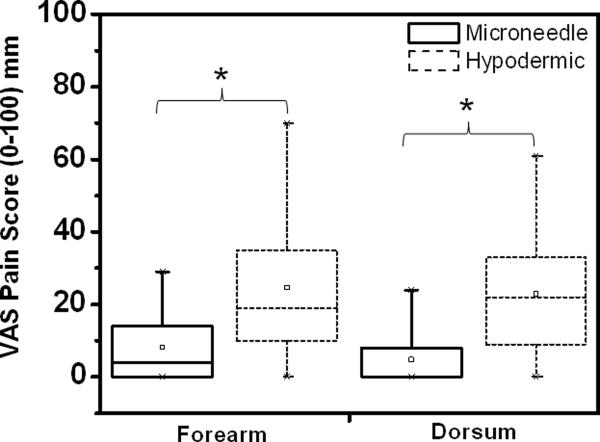
Figure 2.
Box plot representation of visual analog scale (VAS) pain scores associated with lidocaine injection for the forearm and dorsum of the hand. The rectangular box represents the interquartile range (25% to 75%) of the VAS pain scores for each treatment procedure (solid = microneedle; dashed = hypodermic needle) for the different study protocols (forearm injection, dorsum injection). The vertical lines extend from the upper and lower boundary of the box to the maximum and minimum data points. The hollow square inside the box represents the mean pain score for each treatment procedure. The horizontal line inside each box represents the median for the corresponding treatment procedure. Microneedle injection was significantly less painful than hypodermic needle injection for both the forearm and dorsum of the hand procedures. * p<0.05

