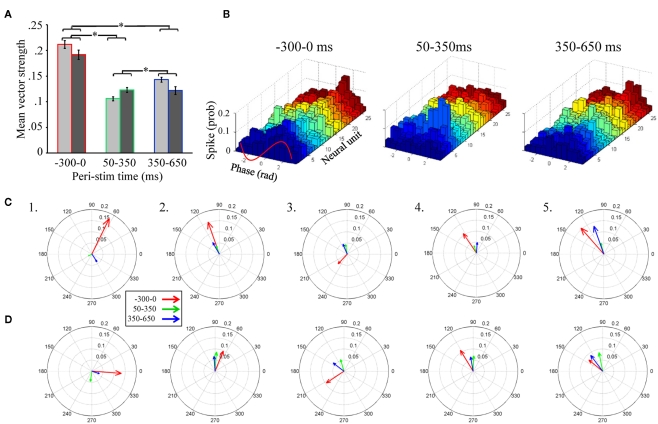
Figure 5.
Unitary spiking phase locks to LFPOs as an ongoing not odor-driven process (A). Mean unitary vector strength as a function of the three stimulus epochs for the five moths used in this analysis. Results are broken down by LFP band pass filter range. However, note that there are no significant differences within any peri-stimulus response epoch between the 25–55 Hz (light gray) and 55–85 Hz (dark gray) band pass filter implementations. Inset are the results of statistical post hoc comparison mean vector strength values (averaged across filter implementation) across the different peri-stimulus time epochs; means with significant differences are indicated with an asterisk. Errors bars represent SE. (B) Phase lag histograms for all 26 recorded units from a single recording. Results based on one of the four LFPs recording sites, and in response to the 20 presentations of 1-decanol. Results are broken down by spontaneous (300 ms just prior to odor onset), early response (50–350 ms), and late response (350–650 ms). Note that several units (but not all, for example see the light green histogram) show a tendency to spike on the rising phase of the oscillation cycle (between 0 and 1.57 radians; see also inset red wave) during spontaneous activity. During odor-driven responses only one unit retains a strong (increased) phase relationship to the oscillation while the bulk of the units lose their phase relationships. (C) Population-level vector strength as a function of the three stimulus epochs. Results are for the 25 to 55-Hz band pass filter implementation and each panel represents a different animal. (D) The same as (C) except using LFP data that was 55–85 Hz band pass filtered.

