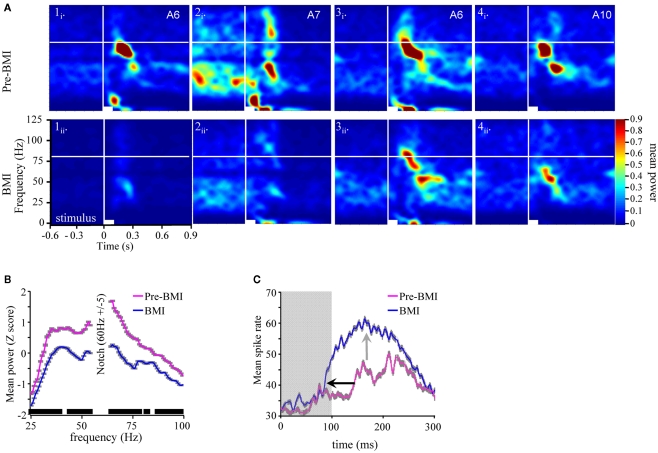
Figure 7.
Bicuculline significantly reduces odor-driven FM oscillatory responses (A). TFR analyses from four separate experiments (columns 1–4) in response to odor prior to (i) versus during BMI application (ii). All panels are the result of TFR analyses that were calculated, normalized, and presented as described in Figure 1. Inset in the upper right corner of each panel (i) are the odorants used to generate both (i) and (ii). (B) Mean z-score normalized oscillatory power by frequency for pre versus during bicuculline (BMI) application. Inset in gray shading are the standard errors for each frequency step. We also performed a post hoc one-tailed paired t-test. Significance level was set at 0.0005 to maintain an overall post hoc type 1 error rate of 0.05. Inset black bars above X-axis represent ranges of frequencies where power was significantly decreased as a function of BMI application; breaks in the bar indicate frequencies that were not statistically different. Overall only 16 of 84 tests were not significant. (C) Mean peri-stimulus population response histogram averaged over all responses to all odors for the five moths used in this series of analyses (gray shaded area around each trace represents SEM). Gray box indicates Stimulus duration. Inset arrows highlight the decrease in response onset latency (black) and increased spike rate during the response (gray).

