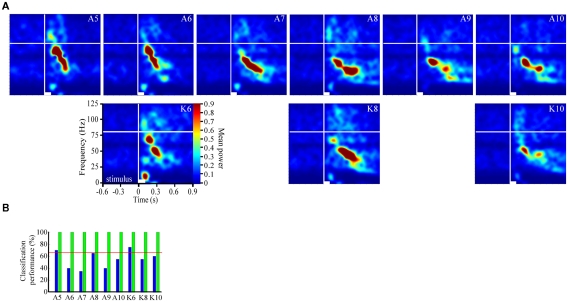
Figure A2.
Replication of Figure 2 using data from a different moth to highlight that FM modulation is odor dependent. (A) Each panel represents the averaged result of 20 individual TFR analyses that were calculated, normalized and presented as described in Figure 1. Note that alcohols and ketones of common length are aligned into columns. (B) Results of the discriminant analysis for the data shown in (A). Blue Bars represent classification performance for the linear kernel function, whereas green bars represent performance of the third order polynomial kernel function. Inset red line represents the 95% confidence interval. Note that the linear kernel function classified responses of two of the nine odorants significantly above chance, whereas the polynomial function accurately classified all odor responses with 100% accuracy.

