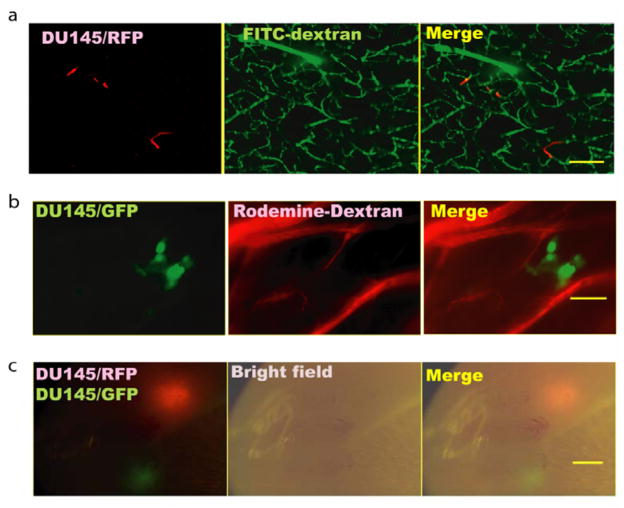
Figure 3. Brain metastasis progression visualized by fluorescence imaging.
a. Ex vivo confocal image of thick brain slices showing RFP expressing DU145/RasB1 cells (red) in FITC-conjugated dextran-labeled blood vessels (green) 3 days after tumor cell inoculation; (scale bar = 100 μm). b. Micrometastatic cluster of GFP expressing DU145/RasB1 cells (green) in the brain adjacent to rhodamine-conjugated dextran-labeled blood vessels (red) 10 days after tumor cell inoculation; (scale bar =50 μm). c. Two brain metastases generated from an equal mixture of GFP and RFP expressing DU145/RasB1 cells; (scale bar =1 mm).

