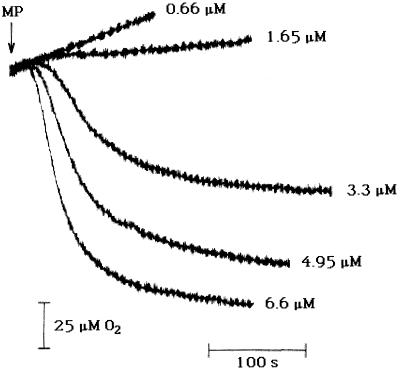
Figure 5.
The effect of MP concentration on O2 consumption in the light. This figure shows O2 consumption measurements compiled from five separate PAM experiments. In each experiment 2 mL of 5 mm Mes and 1 mm CaSO4, pH 6.0, contained 3 × 10⁶ cells. Aliquots of MP were added to give the concentrations indicated.

