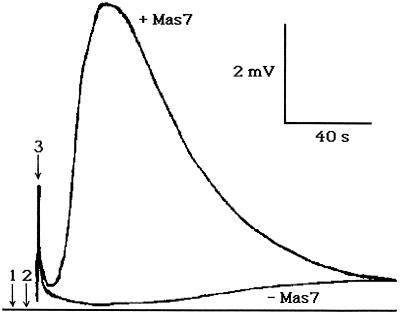
Figure 6.
The effect of Mas7 on O2⋅− production. Three million cells were incubated in 330 mL of 1 mm CaSO4, pH 5.5, for 5 min. Arrow 1 indicates the addition of 5 μm Mas7 to the cell suspension. Arrow 2 indicates transfer of 200 μL of the cell suspension to the luminometer cuvette. Arrow 3 indicates an artifact due to stray light detected by the photomultiplier as the cuvette is inserted into the luminometer. This figure is a representative of six runs.

