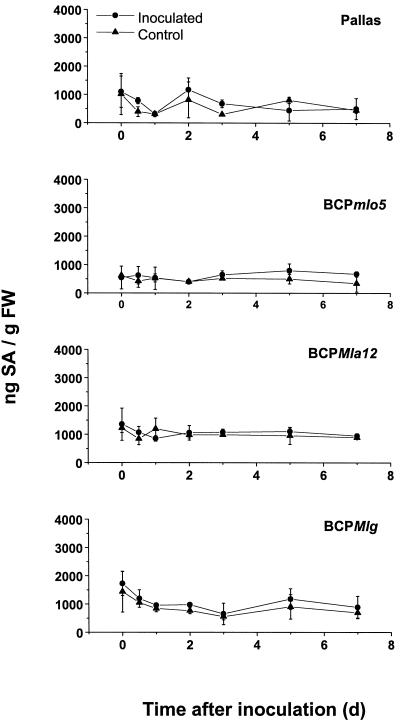
Figure 5.
Endogenous levels of total SA in NILs at different time points after inoculation with BghA6. Seven-day-old primary leaves of the barley lines were inoculated with 20 conidia mm−2. At the indicated time points, leaves were cut off and levels of total SA were determined by HPLC and fluorescence detection. Each point represents the average of duplicates or triplicates of five leaves. Error bars show the sd of the triplicates. Repetition of the experiments led to similar results. FW, Fresh weight.

