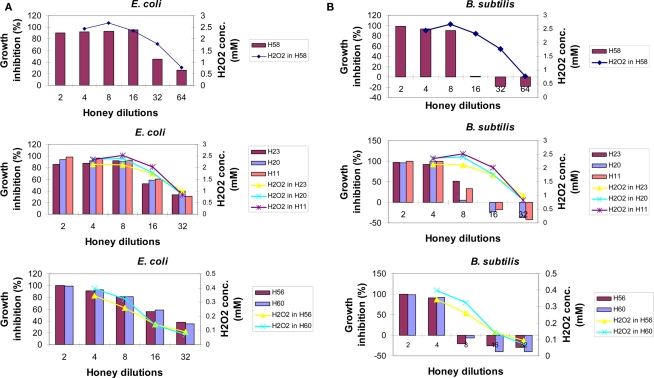
Figure 3.
The relationship between bacteriostatic effect of honey and the content of en-H2O2 on E. coli (A) or B. subtilis cultures (B) Growth inhibition profiles were determined for different honeys using the broth microdilution assay (columns). The content of honey H2O2 at each honey dilution was determined using the peroxide/peroxidase assay, as described in the Section “Materials and Methods.” Of note: growth inhibition profiles of artificial honey of osmolarity equal to that of natural honey provided MIC90 values of 25% (v/v) against both E. coli and B. subtilis. Each point or column represents the mean values of three separate experiments run in triplicate.

