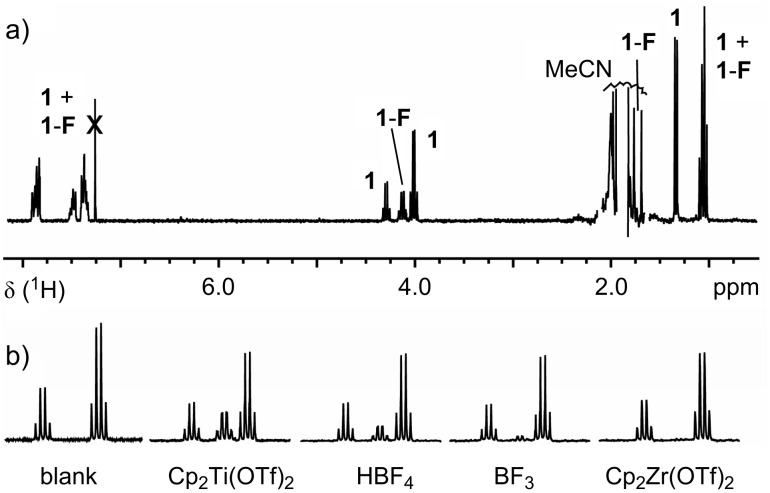
Figure 3.
1H NMR (250 MHz) spectra of fluorination reaction mixtures diluted with CDCl3 and filtered. a) Full range spectrum with signals from substrate 1 and product 1-F. The catalyst was Cp2Ti(OTf)2. Signals resulting from F–TEDA or H–TEDA are missing because of the insolubility of those species in CDCl3. The signals for MeCN and its 13C-satellites have been cut for clarity. b) Reaction progress monitoring after 28 h (region 3.9–4.3 ppm) in catalytic reactions with the Lewis acids indicated, along with the results from a blank experiment.

