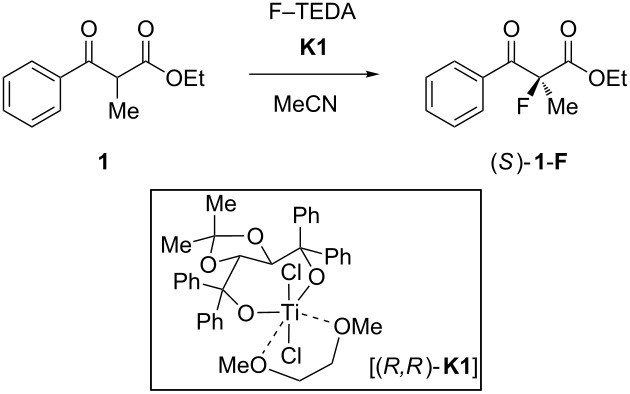
Table 2.
Effect of catalyst loading, temperature, and water content on the fluorination of 1 with catalyst K1.a
 | |||||
| Entry | K1 (mol %) | T (°C) | Additives (mol %) | t (h) | ee (%) |
| 1 | 1.2 | rt | 45b | 25.2 | |
| 2 | 5 | rt | 6 | 26.6 | |
| 3 | 10 | rt | 2 | 26.5 | |
| 4 | 20 | rt | <2 | 25.5 | |
| 5 | 50 | rt | <0.3 | 23.4 | |
| 6 | 100 | rt | <0.3 | 22.4 | |
| 7 | 5 | rt | MS 3 Å | 6 | 27 |
| 8 | 5 | rt | 6 | 28.5c | |
| 9 | 5 | rt | H2O (5) | 10 | 28.5 |
| 10 | 5 | rt | H2O (50) | >12d | 28 |
| 11 | 5 | rt | H2O (1000) | – | –e |
| 12 | 5 | 0 | 16 | 32 | |
| 13 | 5 | rt | <8 | 28 | |
| 14 | 5 | 40 | <2 | 23 | |
| 15 | 5 | 60 | 0.1f | 18 | |
aAll reactions were performed in reagent grade acetonitrile stored over 3 Å molecular sieves and run to complete conversion (TLC), unless otherwise mentioned. bReaction stopped before complete conversion. cEntries 1–6 vs 7–11 vs 12–15 were run with different batches of F–TEDA, solvent and catalyst, leading to small selectivity deviations under seemingly identical conditions. d50% conversion. eNo reaction. fConversion stopped at 80%.
