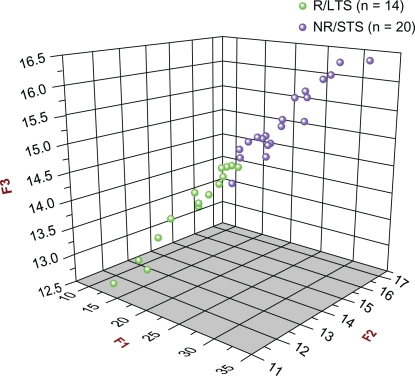
Figure 2.
3D Scatter plot of all 34 original subjects [14 R/LTS (green) and 20 NR/STS (purple)] used in the Discovery Study in connection with the F1, F2, and F3 prognostic biomarker models. The F1, F2, and F3 scores of all 34 original subjects are plotted against each other (F1 vs. F2 vs. F3). As can be seen, there are two distinct, separate clusters: the green one (R/LTS group) is at the front and at a lower level, whereas the purple one (NR/STS group) is at the back and at a higher level. It can also be seen that one subject from the NR/STS group was misclassified.

