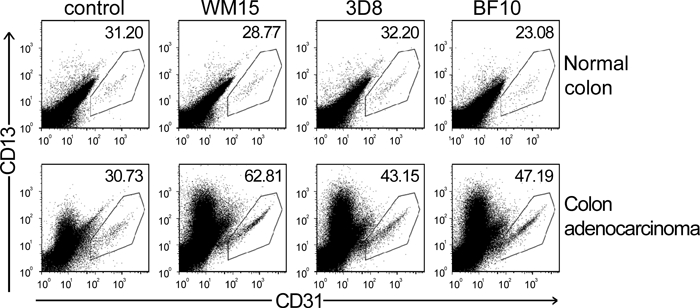
Figure 2.

Flow cytometry analysis on CD31+CD45− endothelial cells obtained from homogenized human tissue specimens of paired normal colon (upper dot-plot panels) and colon adenocarcinoma (lower dot-plot panels; n = 2) stained with isotopic control, WM15, 3D8, and BF10 monoclonal antibodies. CD31 expression is shown on the x-axis and the region in each dot-plot panel corresponds to gated CD31+CD45− cells; CD13 expression is shown on the y-axis, and the number at the upper-right corner in each dot-plot panel corresponds to the CD13 median fluorescence intensity (MFI).
