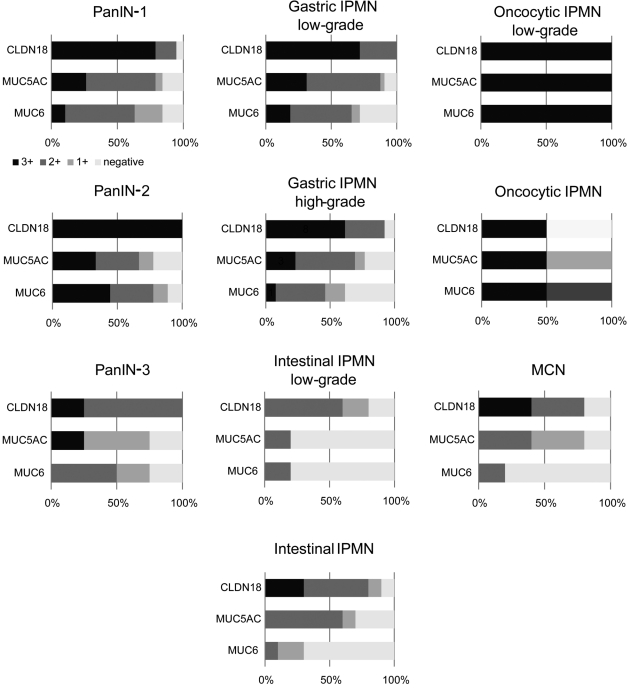
Figure 4.
Stacked bar graphs (100%) of CLDN18, MUC5AC, and MUC6 expression percentage in precancerous lesions. The horizontal axis indicates percentage. The black bar indicates strong labeling for CLDN18, MUC5AC, or MUC6. The dark gray bar shows moderate labeling, the light gray bar shows mild labeling, and the white bar shows negative labeling.

