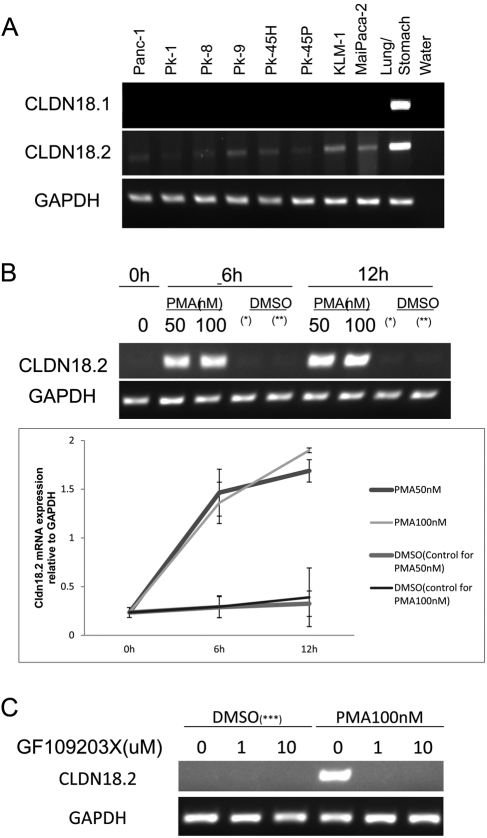
Figure 6.
(A) Analysis of CLDN18 isoforms in eight pancreatic cancer cell lines using RT-PCR. (B) Pancreatic cancer cell line PK-1 was treated with 50 nM and 100 nM PMA for different time periods. The CLDN18.2 mRNA levels were evaluated using RT-PCR. The average volumes of triplicate experiments were plotted with the respective standard deviations. GAPDH was used as the internal control. (*) The control for the sample with 50 nM PMA treatment. (**) The control for the sample with 100 nM PMA treatment. (C) Pancreatic cancer cell line PK-1 was treated with 100 nM with or without the pan-PKC inhibitor, GF109203X, for 12 hours. Each experiment was performed at least three times. (***) The control for the sample with 100 nM PMA treatment.

