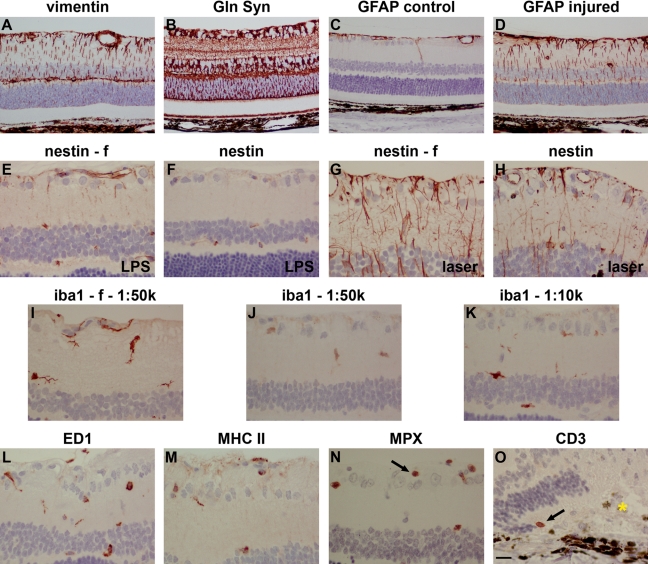
Figure 4.
Representative images of macroglia (astrocytes and Müller cells), microglia, neutrophils, and T cells in Davidson’s- and formalin- (f) fixed retinas, as shown by immunohistochemistry. Müller cell and astrocytes in a normal retina labeled by (A) vimentin and (B) glutamine synthetase (Gln Syn). Glial fibrillary acidic protein (GFAP) labeling of astrocytes in a normal retina (C). Upregulated GFAP expression in astrocytes and Müller cell processes following laser photocoagulation (D). Nestin labeling in Davidson’s- and formalin-fixed retinas after lipopolysaccharide (LPS) treatment (E, F) and laser photocoagulation (G, H). In both cases, nestin immunoreactivity was weaker in Davidson’s-fixed retinas compared with those fixed in formalin. (I) Microglia in a normal, formalin-fixed retina labeled by iba1. (J, K) In normal, Davidson’s-fixed retinas, iba1 labeling was weaker, even at 5-fold higher concentration of antibody. (L) Phagocytic microglia labeled by ED1 following laser photocoagulation. (M) Major histocompatibility complex (MHC) class II–positive microglia following laser photocoagulation. (N) Neutrophils labeled by myeloperoxidase (MPX) following laser photocoagulation. (O) A T cell labeled by CD3 following laser photocoagulation. The gold asterisk indicates the position of the laser lesion. Scale bar: A-D = 30 µm; E-O = 15 µm.

