
Figure 2.
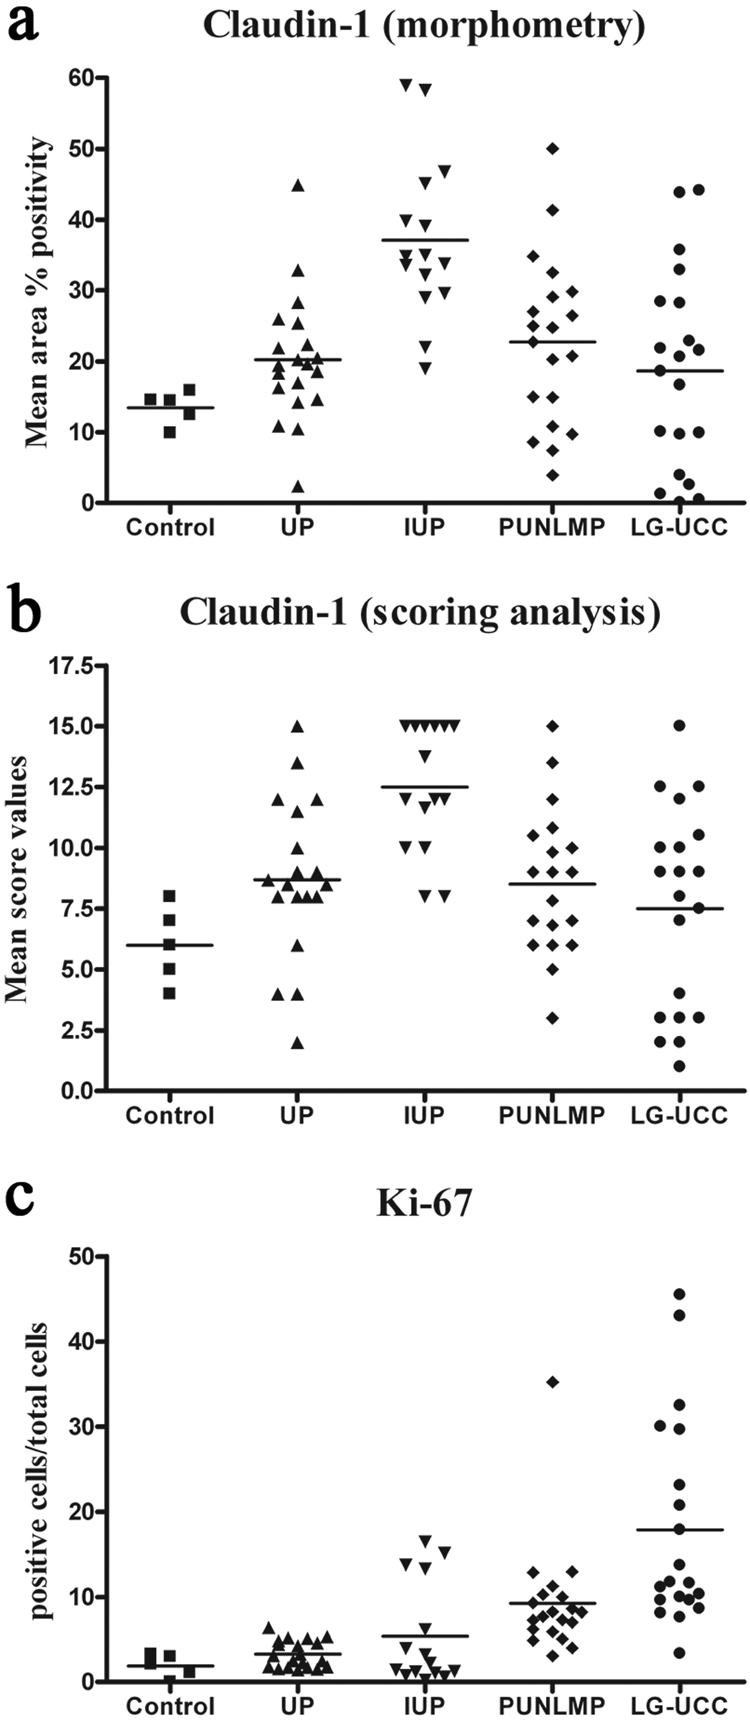
Dot plot of claudin-1 morphometry (A), scoring analysis (B), and Ki-67 (C). IUPs revealed significantly higher claudin-1 expression in comparison to the other investigated groups. LG-UCCs revealed significantly higher Ki-67 expression when compared with normals, UPs, and IUPs. PUNLMPs showed significantly higher Ki-67 expression in comparison to UPs. UP = urothelial papilloma; IUP = inverted urothelial papilloma; PUNLMP = papillary urothelial neoplasm of low malignant potential; LG-UCC = low-grade urothelial cell carcinoma.