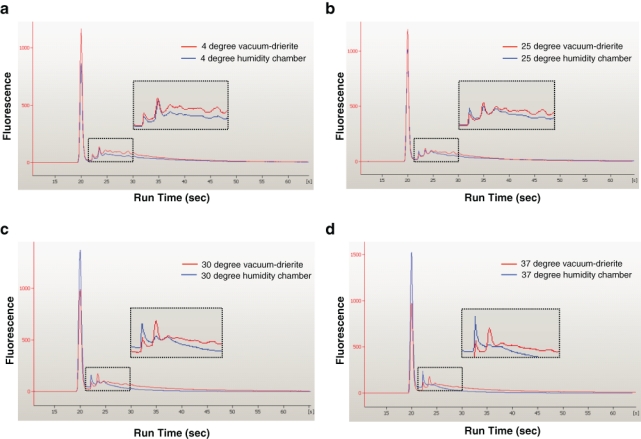
Figure 3.

Assessments of protein profiles according to storage conditions. Protein quality was analyzed on the Agilent 2100 bioanalyzer, using 1 µg of denatured total protein extracted from mouse kidney formalin-fixed paraffin-embedded tissue sections under different storage conditions. Representative data are presented as an eletropherogram, in which the first peak on the left is a protein marker.
