
Figure 2.
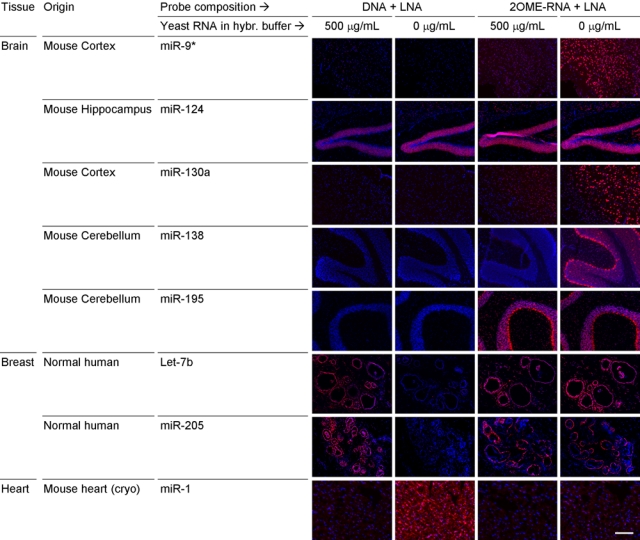
Fluorescent detection (TSA) of in situ hybridizations to various miRNAs, using DNA + LNA and 2OMe + LNA probes in hybridization buffers with or without yRNA. Hybridization signal is shown in red (Cy3) and cell nuclei are shown in blue through counterstaining with DAPI. Pictures for a specific miRNA (set of four images) were acquired at identical exposure times to facilitate visual comparison of hybridization signal intensity. Bar = 200 µm.