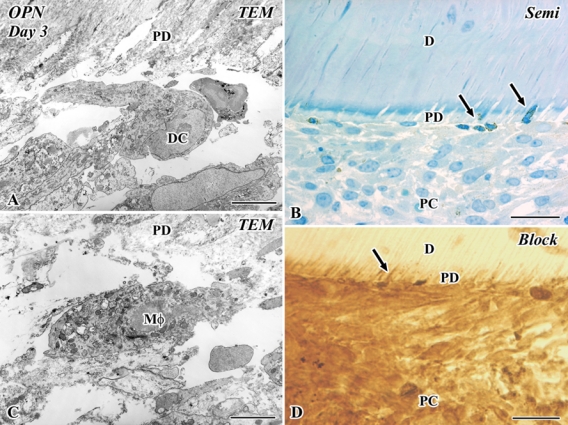
Figure 4.

Electron micrographs (A, C), a semi-thin section (B), and an Epon block after the cutting of ultrathin sections (D) of osteopontin (OPN) immunoreactivities in the transplanted tooth at 3 days after operation. D, dentin; PC, pulp chamber; PD, predentin; TEM, transmission electron microscope. (A, C) A macrophage (Mφ) and a dendritic cell (DC) appear at the pulp-dentin border. (B, D) OPN-positive cells are arranged along the pulp-dentin border, and some of them extend their cellular processes into the dentinal tubules (arrows). Bars: B, D = 25 µm; A, C = 5 µm.
