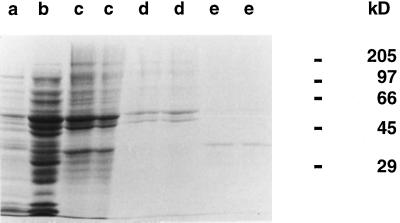
Figure 3.
SDS-PAGE analysis of protein fractions in the course of partial purification of ACAD from embryonic axes of early-germinating sunflower seeds. The different protein fractions were obtained as described in Methods and in the legend of Figure 2. Aliquots of the 0% to 40% (lane a, 100 μg of protein) and 40% to 60% (lane b, 100 μg of protein) ammonium sulfate fractions, of the pooled fractions from the DEAE-Sepharose step (lanes c, 100 μg of protein), and of ACAD1 (lanes d, 50 μg of protein) and ACAD2 (lanes e, 12.5 μg of protein) preparations were separated by SDS-PAGE. Proteins were visualized by Coomassie blue staining. The migration of molecular mass markers is given on the right.

