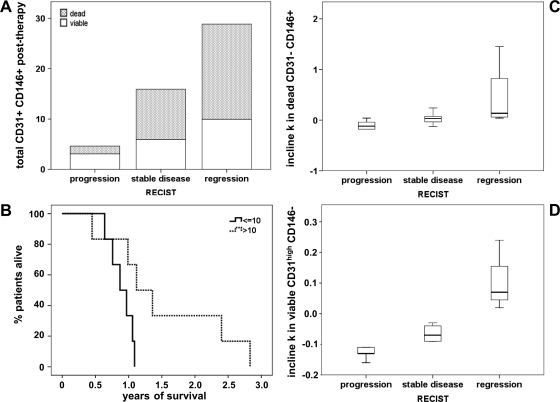
Figure 7.
Association of blood cell populations with treatment response or survival. Posttherapy levels of total (dead and viable) CD45- CD31+ CD146+ cells are presented by stacked bar plot according to treatment response (A). On the basis of the posttherapy levels of dead CD45- CD31+ CD146+ cells, patients were divided into two groups with high (>10) versus low (≤10) CEC counts per 500,000 blood cells, and the corresponding survival curves are plotted (B). The calculated parameter incline (k) during therapy is illustrated by box plot for dead CD45- CD31- CD146+ (C) and viable CD45- CD31high CD146- cells (D) in relation to treatment response according to RECIST criteria.

