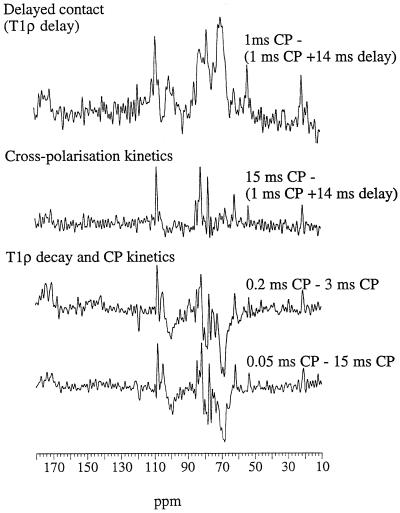
Figure 3.
Difference subspectra corresponding to the mobile elements and derived from rapid T1ρ decay (top spectrum), slow CP (middle spectrum), or both (bottom two spectra). Each point in the subspectrum corresponds to the difference in signal intensity (after normalization of the cellulose C-4 signals) between the corresponding points in the respective spectra.

