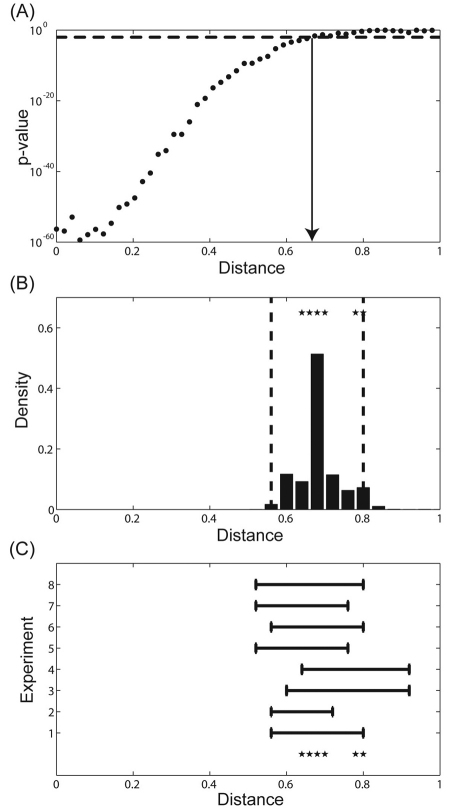
Fig. 3.
Point estimate and associated confidence interval. (A) P-value for pairwise comparison of the means of the signal intensities at a given position along the DV axis (x) and a baseline value (x=1). Dotted line indicates the cut-off chosen for level of significance. The estimated range of nuclear Dl gradient is indicated by the solid arrow. (B) Probability distribution for the estimated spatial range. Dotted lines indicate the 95% confidence interval. Stars represent the estimated range of Dl for eight independent experiments using the pairwise t-test. Sample sizes for the experiments are as follows n1=72, n2=76, n3=50, n4=72, n5=78, n6=74, n7=74, n8=80. (C) 95% confidence interval estimated by each independent experiment. Stars represent the estimated range of Dl for all experiments using pairwise t-test.

