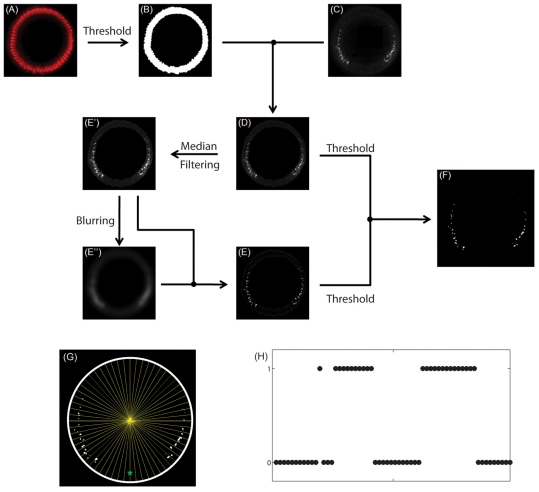
Fig. 4.
Quantification of sog expression. (A) Nuclear staining using DAPI. (B) Nuclear layer close to the embryo surface, obtained by applying a cutoff threshold for intensity in A. (C) Fluorescent in situ hybridization staining for sog intronic probe. (D) sog signal within the nuclear layer. (E) Non-linear filtering of the image in D. E′ is obtained from D using median filtering. E″ is obtained from E′ using Gaussian blurring. (F) Identified sog probes in the embryo, obtained by applying cutoff thresholds for the images in D and E simultaneously. (G) Binning the expression of sog intronic probes along the DV axis. (H) Binary vector resulting from image processing of data from a single embryo.

