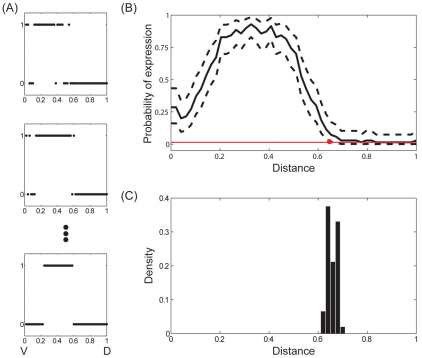
Fig. 5.
Spatial range of sog expression. (A) Examples of sog expression profiles in different embryos (n=68). (B) Mean sog expression profile during nuclear cycle 14 of embryogenesis. 0/1 corresponds to the ventral/dorsal sides of the embryo, respectively. Dashed curves indicate the 99% Bayesian confidence interval for probability of transcription at each point. From x=0 to x=0.66, the 99%CI for probability of transcription does not include the expected value of P(i) when there are no instances of expression. Therefore, we estimate the range of sog expression to be 0.66. (C) Probability distribution for the estimated range of sog expression.

